NR-709A takes DNP Project and Practicum IV at 2 credits and 128 clinical hours. It is the evaluation stage. The writing this block usually carries is the results section, and a results section has one rule that governs everything: report, do not interpret. Numbers, denominators, periods, comparisons made on identical definitions, missing data declared. The meaning comes later. Students lose more marks here by explaining their findings too early than by any weakness in the findings themselves.
We put in no hours, approach no preceptor and no site, complete no placement form, enter nothing in a log and take no assessment. Those belong to you and to Chamberlain. Writing is our whole contribution: the results presentation, the tables and figures, the statistical or run-chart description and the scholarly sections your rubric grades.
What NR-709A actually grades
The first row is comparability. Your baseline and your post-intervention figures must be produced by the same rule, from the same source, over comparable periods. If the baseline came from a report and the post-intervention number came from a manual audit, that difference has to be stated, because it may explain more of the change than the intervention did. Committees check this before they look at the size of the result.
The second row is restraint in language. A pre-post project on one unit with no control group can show that a measure moved. It cannot show that the intervention caused the movement, because the period contained everything else that happened on that unit. Writing results in language the design can pay for is the mark of doctoral work here, and it is what makes the discussion section possible in the next block.
How we help in NR-709A
Our doctoral writers present results the way a committee reads them: counts before percentages, identical definitions on both sides of the comparison, process and balancing measures alongside the outcome, missing data declared, and no interpretation until the discussion. Tables come back with denominators visible rather than implied.
Deliverables run the standard promise: a premium original draft in 24 to 48 hours, targeted at the A band of your course's actual scale, through the eight-person pipeline with both QA passes and the floor check, revised free until it lands.
In NR-709A right now?
Send your rubric, your measurement plan and your data. First premium sample free, floor-checked, back in 24 to 48 hours.
Read the rubric before the prompt
Results rubrics are the most mechanical in the sequence, which makes them the easiest to satisfy fully. Copy the criterion rows out into a blank document and flag every one that expects a table or a figure. A results section is usually scored partly on presentation, and a well-built table can satisfy two or three rows that prose would only partly answer.
Then price the narrative. A 1,200-word results section with three rows at 55, 25 and 20 percent leaves 660, 300 and 240 words. The 660-word row is the outcome results, the 300 usually covers process and balancing measures, and the 240 is the sample description. Notice what is absent from that budget: interpretation has no allocation at all, because it belongs in a different section and often a different deliverable.
Before writing, lay out every number in a single working table with its definition, source, period and count. Doing that first exposes the mismatches, a denominator that changed, a period one month shorter than intended, a measure collected differently after week six, while there is still time to describe them properly rather than discovering them in the middle of drafting.
The shape of a results section
These are the parts a committee reads for. Each supplies something a reader needs before any interpretation can begin.
| Part | What it has to prove | How a thin version looks |
|---|---|---|
| Sample and period | Who was included on each side of the comparison, how many, and over which dates. | Results reported with no denominator population. |
| Definitions restated briefly | A one-line reminder of numerator and denominator rules so the table can be read alone. | Measures named without definitions anywhere nearby. |
| Baseline and post figures | Counts and percentages on both sides, produced by the same rule from the same source. | A percentage change with no underlying counts. |
| Table or chart | A clear presentation with denominators shown and axes labelled, readable without the text. | A chart with percentages and no sample sizes. |
| Signal assessment | Whether the change exceeds ordinary variation, by run-chart rules or an appropriate test. | Any difference treated as an improvement. |
| Process measures | What was actually delivered, so the outcome can be read against the dose received. | Only the outcome reported. |
| Balancing measures | What might have worsened elsewhere, reported whether or not it did. | Balancing measures omitted because nothing seemed wrong. |
| Missing data declared | How many records could not be classified and how they were handled. | Silence about anything that could not be counted. |
Evidence craft in reporting results
Four habits keep a results section defensible.
Counts first, percentages second. Write that 74 of 96 eligible admissions were screened within 24 hours, compared with 52 of 101 at baseline, and then give the percentages. Small denominators make percentages jump, and a reader who sees the counts can judge for themselves how much weight the difference carries.
Report the same period length on both sides where you can. A three-month post-intervention window compared to a twelve-month baseline is not wrong, but it must be stated, because a short window is more exposed to ordinary variation and to seasonality. Where the periods differ, say so in the sentence that reports the comparison, not in a footnote.
Use a signal rule rather than an impression. If you have enough points, a run chart with the standard rules for a shift or a trend is usually the most honest presentation for a project of this size. If you are using a statistical test, name it, say why it fits the data type, and report the effect with its confidence interval rather than a p value alone.
Keep verbs at the level the design supports. The measure rose from and screening was higher during are available to a pre-post project. Improved outcomes and the intervention increased are not, and using them in the results section is the single most common way to lose marks in this block. Save any causal discussion for the section that is allowed to weigh alternatives.
What separates a pass from a strong pass here
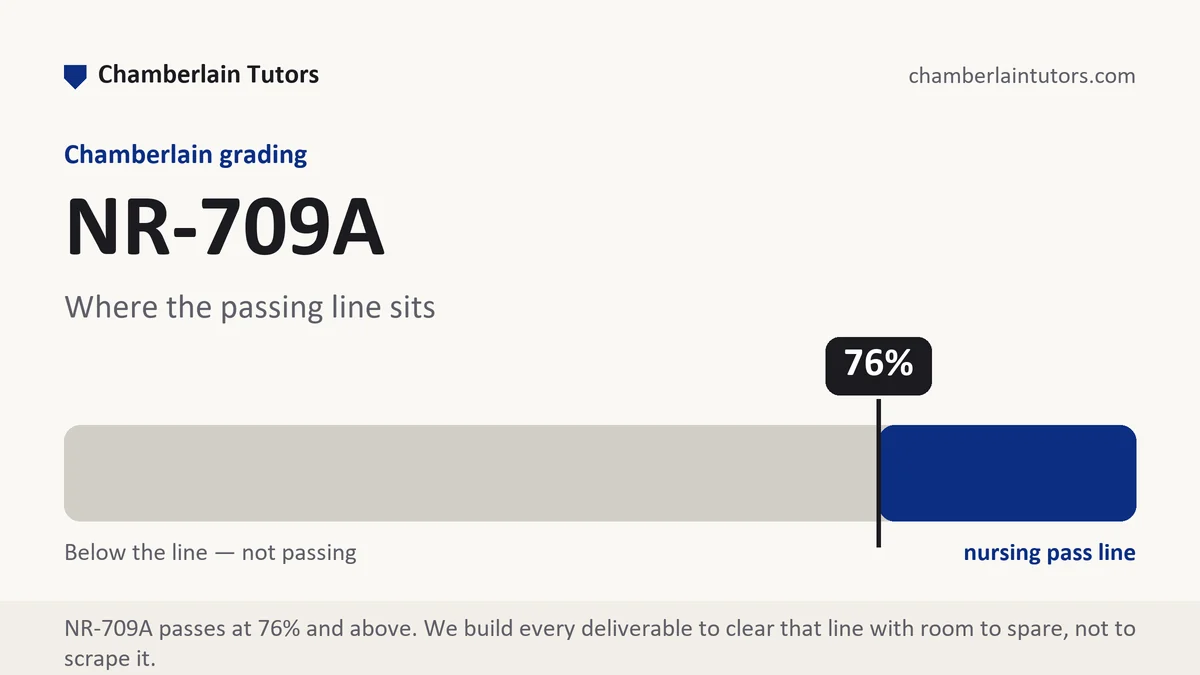
A passing NR-709A results section reports the outcome and states whether it improved. Its usual weaknesses are interpretation mixed into the reporting, percentages without counts, and silence about the measures that did not move. A core nursing course at Chamberlain passes at 76 percent and not beneath it, and nothing supplementary repairs an average that has fallen, so the disciplined version of this section is worth writing properly the first time.
Strong results sections are complete and quiet. They report every measure that was planned, including the ones with disappointing or absent movement, because a plan that promised four measures and reports one invites the obvious question. They show denominators everywhere. They declare missing data and say how it was handled. And they stop before meaning, which reads as confidence rather than as omission: a committee that finds a clean results section trusts the discussion that follows it, and a committee that finds interpretation inside the results starts checking everything.
Six mistakes that cost points in NR-709A
- Interpreting inside the results. Explanation belongs in the discussion. Mixing them costs marks in both sections.
- Percentages without counts. With small denominators a percentage can move dramatically on two or three cases.
- Different denominators before and after. If the rule changed, the comparison is not measuring what it appears to measure.
- Missing data unmentioned. Records that could not be classified are part of the result, and silence about them reads as an oversight.
- A p value treated as proof. Significance is not size, and in small projects it is often unavailable or unhelpful.
- Claiming the intervention caused the change. An uncontrolled pre-post design cannot support that, and asserting it undermines the entire evaluation.
Questions NR-709A students ask
My measure barely moved. How do I write that up?
How many data points do I need for a run chart?
Should I run statistical tests, or is a chart enough?
Where NR-709A sits in Chamberlain's programs
Open the exact program map for sequence, credit, and option context. The current student schedule and syllabus remain authoritative after transfer evaluation, electives, state rules, and approved plan changes.
The weeks, one by one
Week 1
NR-709A carries the project practicum at 2 credits and 128 clinical hours, and this stage of the sequence is where the work turns from doing the change to judging it. Read the full Week 1 manual.
Week 2
The second stage of an evaluation term is usually specification: writing down, at a level of detail that would let a stranger reproduce your figures, exactly what each measure counts. Read the full Week 2 manual.
Week 3
Roughly a third of the way into an evaluation term the data stops being a plan and becomes a file, and the written task turns to assembly and integrity: what you pulled, from where, over what period, what was missing, what was duplicated, what changed inside the system during your measurement. Read the full Week 3 manual.
Week 4
Halfway through an evaluation term the numbers have to become something a reader can see, and the choice of display is an analytic decision rather than a cosmetic one. Read the full Week 4 manual.
Week 5
Before an evaluation can say whether a change worked it has to establish that the change happened, and that is what this stage of the sequence is for. Read the full Week 5 manual.
Week 6
The discussion section of a doctoral project report is where careful evaluations are most often undone, because this is where the pull toward a causal claim becomes strongest. Read the full Week 6 manual.
Week 7
Near the end of an evaluation term the question changes from whether the change worked to whether it will still be running in a year, and the written product is a sustainability and handoff plan. Read the full Week 7 manual.
Week 8
The last stage of an evaluation term is assembly and dissemination: pulling eight weeks of sections into one coherent document that says the same thing from beginning to end, and translating it into whatever product will actually reach the people who could use it. Read the full Week 8 manual.