NR-503 applies epidemiological and statistical principles to population risk: identifying it, measuring it, and proposing something that acts on it. The graded skill is not statistics in the sense of calculation. It is the discipline of writing about groups of people without breaking the arithmetic, which mostly comes down to always knowing who is in your denominator and over what period you counted. This page is the manual for that discipline.
What NR-503 actually grades
Four abilities show up across the scoring rows. Defining a population precisely enough that someone else could count it. Choosing the right measure for the question, which usually means knowing whether you want new cases or existing ones. Reading determinants at the population level rather than as a list of individual habits. And proposing an intervention aimed at a level where population change actually happens, with a way to tell whether it worked.
Clinical experience helps less here than students expect, and occasionally hurts. Bedside reasoning starts from one patient and generalizes outward. Population reasoning starts from a defined group and stays there, so a paper that keeps sliding back into what the nurse should assess in the patient is answering a different question than the guide asked.
How we help in this course
Send the prompt, the scoring guide from Canvas, and the population or condition your section has assigned or that you want to work with. The draft comes back with the population defined as a countable group, measures named correctly and not used interchangeably, every figure carrying the base and the time period it came from, determinants organized by level rather than as a list, and an intervention with an evaluation measure attached rather than a hope.
Work moves through the pipeline in the usual order: your guide decoded row by row, core deliverables tagged apart from supplemental, a writer matched to population health and epidemiology material, a rubric pass followed by an independent APA and originality pass, the scale check against your section's floor, and delivery inside 24 to 48 hours.
How to write this course's deliverables
Chamberlain publishes no syllabi outside Canvas, so this manual describes craft rather than weeks. What follows works on any prompt this course produces: converting the scoring guide into a section plan with words attached, the parts an epidemiological analysis has to contain, and the statistical habits that keep a graduate paper honest without turning you into a statistician.
In NR-503 right now?
Send the week and the rubric from Canvas. First premium sample free, floor-checked, back in 24 to 48 hours.
Where the arithmetic of the gradebook bites
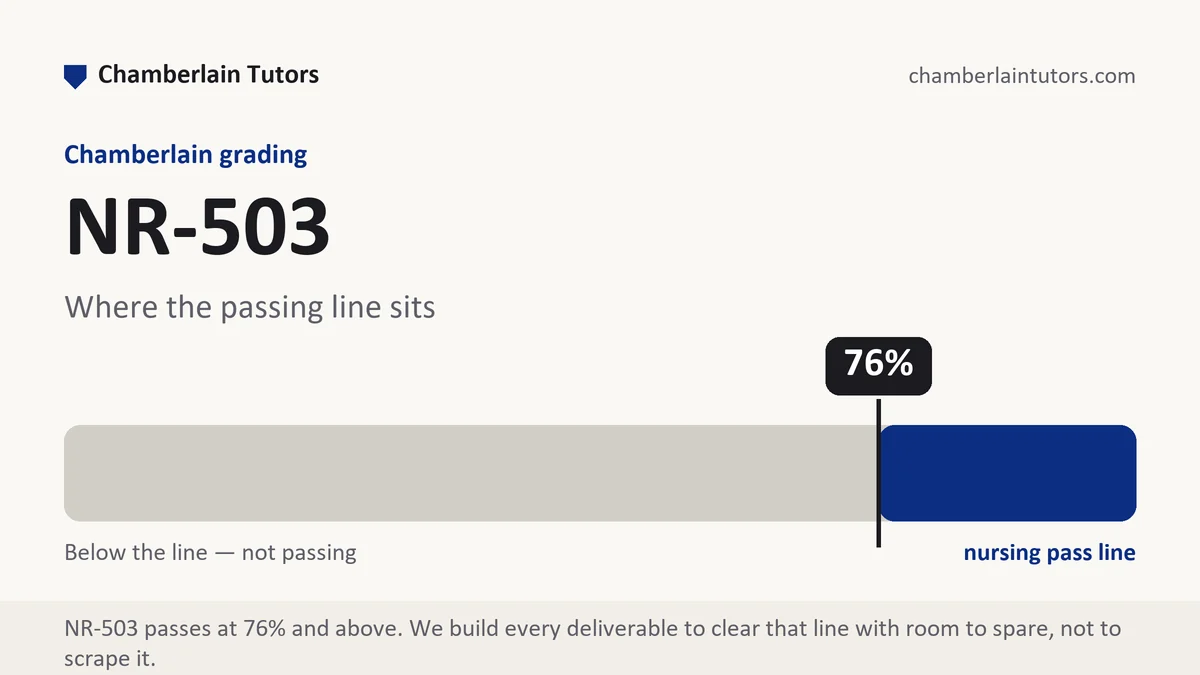
Core nursing courses carry a 76 percent floor, core assignments average separately from supplemental ones, and supplementary work cannot pull up a weighted average that has already sagged. NR-503 has a particular way of producing that sag: the graded pieces are long, they arrive weekly inside an eight week session, and each one contains numbers that a grader can check. A misused rate is not a matter of interpretation, so the deductions are cleaner and less forgiving than in a discursive course.
The other structural point is the board. Posts do not reopen once submitted at Chamberlain, and in this course boards frequently ask for a statistic. Compose in a separate document, check the figure against its source once more, then paste.
Turn the scoring guide into a section plan
Read the guide before the prompt, and read it with a pen. Every row in an epidemiology guide names either a thing to identify, a thing to measure, or a thing to argue, and those three verbs need very different amounts of room. Copy the rows into a blank document as headings in the guide's order, then mark each with I, M or A so you can see at a glance where the writing effort has to go. Identify rows are fast. Measure rows are slow, because they require sources and checking. Argue rows are the ones students leave until the end and then underwrite.
Then attach words. Suppose the paper is capped at 2,000 words with five rows: the population and problem described with data at 25 percent, the epidemiological analysis at 25, determinants and risk factors at 20, a proposed intervention with evaluation at 20, and APA and scholarly writing at 10. Multiply the four content rows against the cap and the shape appears immediately: 500 words, 500 words, 400 words and 400 words, with the writing row's 200 going to the opening, the closing and the transitions that hold the sections together.
Then apply the reality check this course needs. Five hundred words describing a population with data is not five hundred words of prose; it is three tight paragraphs plus the sourcing behind every figure in them, and gathering those figures takes longer than writing the section. Build the numbers before the sentences: population definition, the measure you will report, the source, the years covered, and the comparison group. With those five items on a scrap of paper the section writes quickly. Without them it becomes adjectives about how serious the problem is.
The parts of an epidemiological analysis
Whatever the deliverable is called in your section, the analysis has to move through this ground. The right column is what a grader reads as unfinished work.
| Part | What it has to establish | The version that loses points |
|---|---|---|
| The population defined | Who is counted, where, in what age range, over what period, so the group could be enumerated by someone else | Adults in the United States, which is a category rather than a population |
| The measure chosen | Whether you are reporting new cases arising or cases existing at a point, and why that choice suits the question | Incidence and prevalence used as synonyms in the same paragraph |
| The source and its vintage | Which surveillance system or dataset, which years, and any limits the source itself acknowledges | A figure attributed to a website with no year attached |
| Comparison that means something | The rate set against another group, another period or a national figure, so the reader can see whether it is high | A single number presented as though it were self evidently alarming |
| Determinants by level | Individual, community and structural contributors separated, with the level of each named | A list of behaviors, which quietly relocates a population problem into personal choice |
| Intervention at a stated level | Prevention aimed at a defined stage, with who delivers it, to whom, and how often | Increase awareness and provide education, with no agent and no dose |
| Evaluation measure | What you would count afterwards, in what group, over what period, to know whether anything changed | Improved outcomes, which cannot be observed |
Statistical habits that keep the paper honest
You are not being asked to run an analysis. You are being asked to write about other people's numbers without breaking them, and four habits cover nearly all of it.
Never write a rate without its base and its window. A percentage is a fraction with the bottom hidden, and the bottom is where the meaning lives. Write that 47 of the 1,240 residents screened during a twelve month period met the criterion rather than that 3.8 percent did, or if the sentence needs the percentage, keep the count and the period beside it. Rates expressed per 100,000 carry the same obligation: say per 100,000 of which population, and in which years.
Keep new cases and existing cases apart. Incidence counts what arose during a period and answers questions about risk and about whether something is spreading. Prevalence counts what exists at a moment and answers questions about burden and about how much service a population needs. A chronic condition with low incidence can have high prevalence because people live with it for years, and a paper that treats the two as interchangeable produces conclusions that do not follow from its own numbers.
Let the design choose the verb. Population data is overwhelmingly observational, so the honest verbs are was associated with, occurred more often among, and predicted. Caused, reduced and prevented belong to studies that changed something deliberately and measured the result. Report the design and the sample before the finding, as in a cross sectional survey of 3,400 adults in two counties, because provenance stated first is what turns an assertion into evidence.
Read precision, not just significance. Where a source gives a confidence interval, use it, because an interval running from barely anything to a great deal is telling you the estimate is unstable and a paper that reports only the central figure has hidden that. Where rates are age adjusted, say so, since comparing a crude rate in an older community against a national adjusted rate is a comparison that proves nothing.
Passing analysis, strong analysis, in NR-503
A passing NR-503 paper picks a real condition, quotes accurate figures, lists risk factors, and recommends education and screening. It is correct and it is generic, and generic is where the middle of the scale lives.
A strong paper differs in three ways. It defines a population you could count, which forces every later section to be about that group rather than about the condition in general. It uses comparison rather than assertion, so the reader sees a rate set against something and can judge the size of the problem instead of being told it is significant. And it proposes an intervention with a level, an agent and a measure attached, so the proposal could be carried out and evaluated by someone who is not you. Papers that do those three things read as public health writing. Papers that do none read as a clinical essay about a disease.
Six mistakes that cost points here
- Percentages with no denominator. The single most common deduction in this course, and the easiest to prevent by writing the count first.
- Incidence and prevalence swapped. The two answer different questions, and using the wrong one usually invalidates the conclusion built on it.
- Causal verbs over survey data. Observational designs support association. Reduced and prevented require an intervention that was actually applied.
- Undated sources. Surveillance figures have a vintage. A statistic with no year is a claim about an unknown moment.
- Determinants written as personal habits. Listing diet and exercise without naming the community and structural level turns a population analysis into individual advice.
- An intervention with no evaluation. If the paper cannot say what would be counted afterwards, the proposal cannot be graded as a proposal.
Questions NR-503 students ask
How do I know whether to report incidence or prevalence?
The best data I can find is a few years old. Does that sink the paper?
How much statistics do I actually have to calculate?
The weeks, one by one
Week 1
NR-503 Week 1 asks you to stop thinking about one patient and start thinking about a group you could count. Read the full Week 1 manual.
Week 2
NR-503 Week 2 is the measurement stage, and it is the one that decides how the rest of the session reads. Read the full Week 2 manual.
Week 3
NR-503 Week 3 works the three questions descriptive epidemiology exists to answer: who, where and when. Read the full Week 3 manual.
Week 4
NR-503 Week 4 moves from describing a pattern to testing whether an exposure and an outcome travel together. Read the full Week 4 manual.
Week 5
NR-503 Week 5 asks a question that looks clinical and is arithmetical: what happens when you apply a test to people who are not sick. Read the full Week 5 manual.
Week 6
NR-503 Week 6 asks the hardest question in the discipline: when is an association worth believing. Read the full Week 6 manual.
Week 7
NR-503 Week 7 turns to communicable disease, where epidemiology started and where its methods are most visible. Read the full Week 7 manual.
Week 8
NR-503 Week 8 asks you to propose something and to say how anyone would know whether it worked. Read the full Week 8 manual.