NR-330 Week 4, in our teaching judgment, teaches the skill that separates a nurse who reads charts from a nurse who reads patients: the serial trend write-up, a piece of analysis built on data collected across days rather than a single assessment. Alterations in life processes rarely announce themselves in one reading; they drift, and a course backed by 144 clinical hours gives you enough consecutive floor time to watch drift happen and enough material to write about it with authority. Your section may print this as NR 330 or NR330; it is the same course. Chamberlain publishes no syllabi outside Canvas. The placement here is our teaching judgment from the course's catalog arc; your section's rubric decides what your week actually asks.
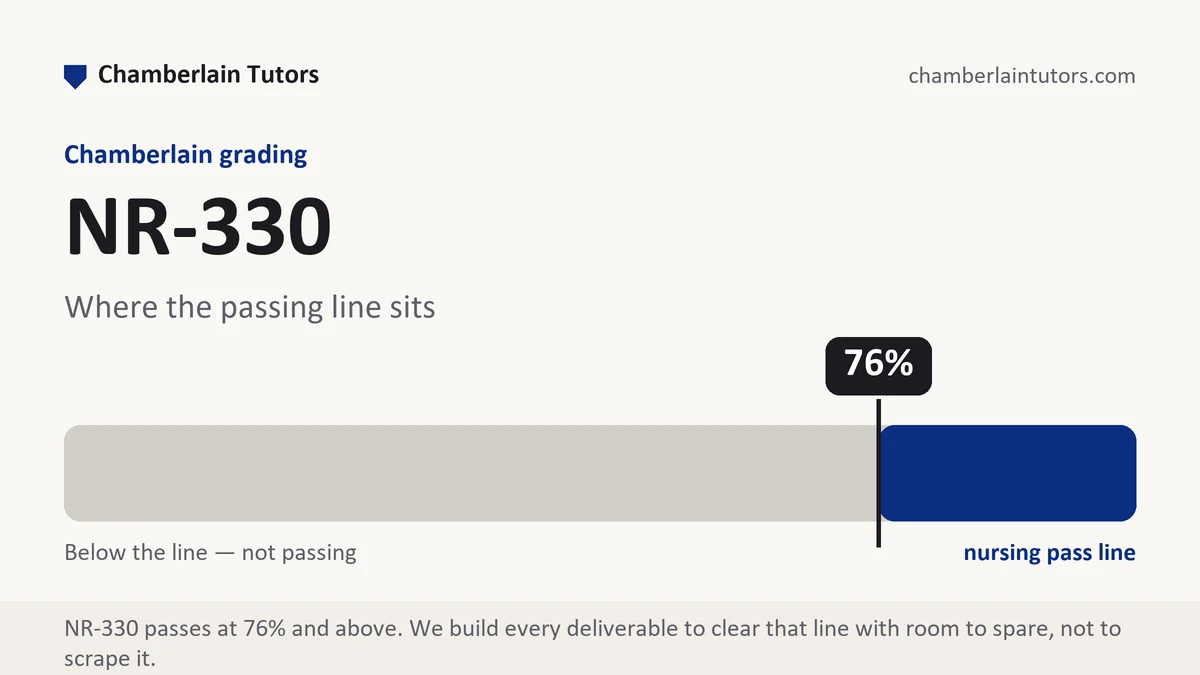
What NR-330 Week 4 asks for
Three mornings in a row, the same numbers on the same whiteboard, and only on the third morning does the story become visible. A 63-year-old man with cirrhosis has been on your unit since Sunday: his daily weight has climbed a little each day, his morning sodium has slipped a little each day, his abdominal girth was measured twice and the second measurement was larger, and the night nurse charted that he needed two pillows Monday and three by Wednesday. Any single value is unremarkable. The series is a message. The written work at this stage of the course, in our judgment, asks you to receive that message on paper: assemble the serial data, describe the trajectory precisely, interpret what process is moving, and say what the trend obligates a nurse to do next.
This is a different genre from the admission write-ups earlier in the session. Admission writing is cross-sectional, a photograph; trend writing is longitudinal, a film, and the analytic verbs change with it. You are no longer just clustering findings; you are computing directions, rates and inflection points, and defending an interpretation of movement. Faculty position this work mid-session because it requires everything the first three weeks built, mechanism knowledge, problem naming, decision structure, and adds the time axis that real deterioration and real recovery actually travel on.
Remote monitoring belongs to this territory now. Patients leave hospitals with cellular scales and blood pressure cuffs that report daily, and clinic nurses watch dashboards of home readings between telehealth visits. A case at this level may hand you fourteen days of home weights around a heart failure discharge and ask what week two shows that week one did not. The reading skill is identical to the whiteboard skill: dressed numbers, honest trajectories, and interpretation that respects the data's limits. Write both fluently and you are writing the course's discharge planning strand before it formally arrives.
The boundary holds: collecting the data at clinical, the measurements, the charting, the logs and signatures, is your own real work and stays that way. The trend analysis you build from a case's data afterward is the written layer this manual serves.
The NR-330 Week 4 method, step by step
Six moves for turning serial data into an argument about a moving process.
-
Tabulate the series before interpreting a single value
Build the table first: parameter, value, unit, date and time, conditions of measurement. Interpretation before tabulation is how students miss that the weights were taken on different scales or the girths at different landmarks, and those discoveries change everything downstream.
-
Compute the trajectory, not just the endpoints
State the direction, the total change, and the rate: up a kilogram over three days is a different sentence from up a kilogram overnight. Where the series bends, name the inflection and the day it happened, because inflections are where causes live.
-
Align the parallel series against each other
Lay the weight trend beside the sodium trend beside the functional observations. Concordant series strengthen an interpretation; a discordant one is a finding in itself. The pillow count climbing while the weight climbs is alignment, and alignment is evidence.
-
Interpret the movement as a process with a mechanism
Write what is moving in physiologic terms, cited: fluid shifting into the third space, effective circulating volume falling, the kidneys responding as they do. The interpretation paragraph is a pathophysiology bridge with a time axis, and it takes the same link-level citation discipline.
-
Audit the data quality before leaning on it
One paragraph on measurement conditions: same scale, same time of day, same landmark, witnessed or reported. Trend claims inherit the weakness of their weakest measurement, and saying so is a scored judgment behavior, not a confession.
-
Convert the trend into an obligation
Close with what the trajectory demands: the parameter to tighten, the frequency to increase, the threshold that triggers a call, the conversation the pattern makes necessary. A trend described but not acted on is a chart, not nursing.
A layout and word budget for a trend analysis
The frame below sizes a written product of roughly 1,000 to 1,300 words. It is our own outline rather than anything the university issues, and your section's rubric outranks it wherever the two disagree.
| Component | What belongs in it | Word target |
|---|---|---|
| Patient and question | The de-identified patient and the clinical question the series is being read to answer. | 100 to 130 |
| Data table and conditions | The tabulated series with units, times and measurement conditions stated for each parameter. | 150 to 200 |
| Trajectory description | Direction, magnitude, rate and inflection points for each series, in prose that a reader could re-plot. | 200 to 240 |
| Alignment analysis | The series read against each other, with concordances and discordances named explicitly. | 160 to 200 |
| Mechanism interpretation | The moving process explained with link-level citations, including what the trend rules out. | 200 to 250 |
| Obligation and thresholds | What the trend requires next: monitoring changes, escalation thresholds, and the conversation it forces. | 140 to 180 |
Evidence craft for serial data
Every trend claim carries three numbers minimum. A direction needs at least a start, an end and a time base; a shape needs the points between. Rising steadily is not evidence until the reader can see the readings that make it steady rather than stepped.
Distinguish measured change from measurement noise. Two scales, two observers, two times of day: before interpreting a small change, show that it exceeds the wobble your measurement conditions produce. Course texts and clinical references give you the expected variability for common parameters; citing one turns caution into scholarship.
Read home-generated series with their provenance attached. Fourteen days of cellular scale data is a gift and a hazard: same scale, unknown clothing, unknown hydration, self-selected timing. Use the trend, state the provenance, and weight accordingly, in the same sentence where the trend does its work.
Let discordance speak. When one series moves and its expected partner does not, resist smoothing it over. Write the discordance, offer the plausible explanations, and name the data that would decide between them. That paragraph is usually the best clinical judgment on display in the whole paper.
Five mistakes that cost points in this week's territory
- Endpoint arithmetic. Comparing day one to day four and skipping the shape between misses inflections, and inflections are where the clinical story turns.
- Trends built on unstated conditions. A weight series interpreted without asking about the scale, the gown or the hour is an argument built on sand, and rubrics at this level check the foundation.
- Single-series tunnel vision. Reading one parameter in isolation when the case supplies parallel series leaves the strongest evidence, alignment, unused on the table.
- Interpretation without mechanism. He is retaining fluid is a label; the cited chain from failing synthetic function to shifting fluid is analysis, and only one of them scores.
- Description without obligation. A beautifully characterized trend that ends without thresholds or actions has answered what happened and ignored so what, and the second question is the graded one.
Before you submit
- Every series is tabulated with units, times and measurement conditions
- Trajectories carry direction, magnitude, rate and named inflections
- Parallel series are read against each other explicitly
- The mechanism interpretation is cited at the link level
- Data quality is audited before the interpretation leans on it
- The close converts the trend into monitoring changes and thresholds
Reading trends for NR-330 Week 4?
Send the data set and the rubric out of Canvas. A premium original draft comes back in 24 to 48 hours with the series tabulated, the trajectories computed and the interpretation cited, and revisions run until the grade lands. Clinical hours and logs stay yours alone.