NR-584 is three theory credits on quality management and safety: the principles, the improvement tools, and the policies that hold continuous improvement together. The writing that scores well has one distinguishing feature. It refuses to end the analysis at a person who made a mistake, and keeps going until it reaches the arrangement that made the mistake likely.
What NR-584 actually grades
Safety science has a specific discipline behind it, and the rubric rows are built to test whether you have absorbed it. The discipline says that harm is usually produced by ordinary people working inside arrangements that set them up, and that the useful question is not who failed but which defence was missing. Students who write from clinical instinct tend to produce careful, sincere papers that identify a lapse in vigilance and recommend more attention. Those papers score in the middle band every time.
The second demand is that improvement be measurable. Quality writing lives or dies on whether the reader can tell how you would know the change worked. A recommendation with no measure attached is an intention, and rows that mention evaluation are written specifically to catch that.
The improvement tools sit underneath all of it. Cause diagrams, process maps and driver diagrams are not decoration; each one is a way of forcing a different question. A cause diagram asks what else could have contributed. A process map asks where the work actually differs from the policy. Rubric rows that name a tool are checking whether you used it to think or reproduced it after the thinking was already finished, and the difference shows in whether anything in the diagram surprises the reader.
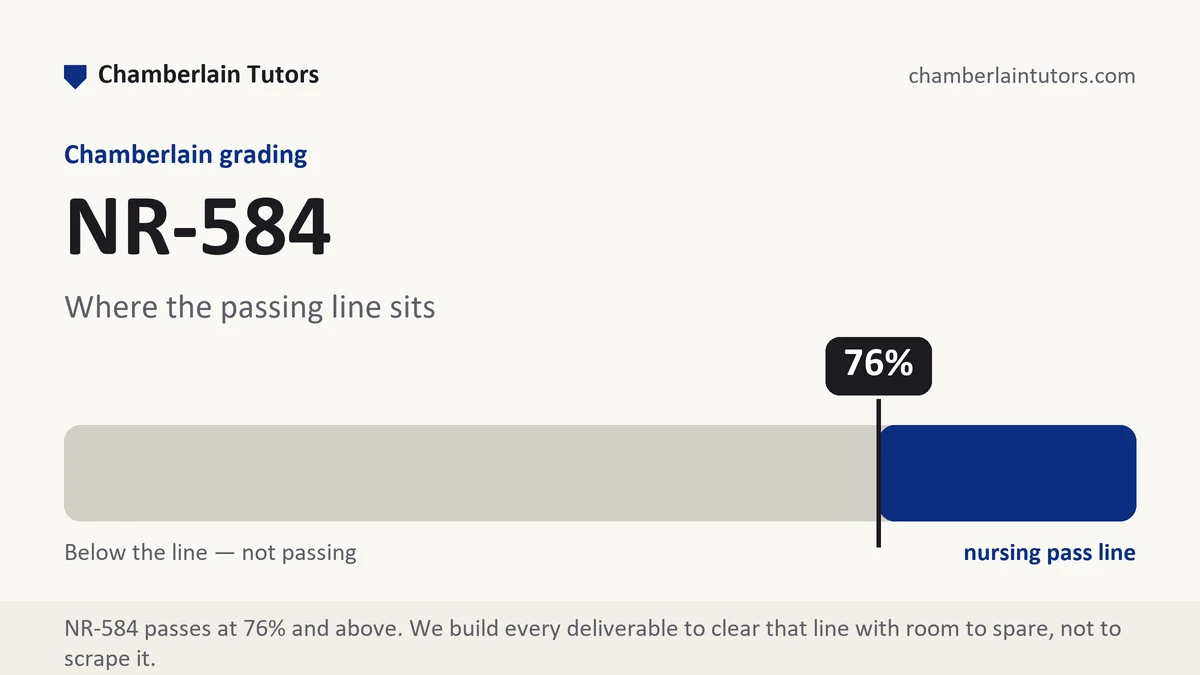
Structurally, this course sits where averages get decided. Chamberlain's floor in core nursing courses is 76, and students taking this inside a nurse practitioner specialty run a scale with no C where 84 is the last passing number. Weekly deliverables inside an eight-week session leave no recovery stretch, and supplementary work cannot rescue a weak weighted average.
How we help in this course
Send the prompt and rubric from Canvas with a de-identified sketch of the event or the process you want to analyze. We build the draft with a real timeline, contributing factors sorted by layer, and corrective actions ranked by how much they actually depend on human vigilance. That ranking is the single biggest score driver in this course and the thing most drafts leave out.
Where your section asks for a tool such as a cause diagram or a process map, we build it to match the analysis rather than decorating the paper with it, and we keep every element of the diagram present in the prose.
Analyzing an event this week?
Send the rubric and a de-identified sketch. We will build the timeline and scope the draft today.
Read the rubric before the prompt
Quality rubrics are unusually literal, which works in your favour. Copy the rows into a blank document and mark the ones that name a deliverable object: a timeline, a diagram, a measure, an action plan. Those rows are checklists, and they are the cheapest marks in the course because a grader either finds the object or does not. Do them first and do them completely.
Then budget the analytic rows in words. Take a 2,400-word cap with rows weighted 30, 30, 25 and 15 percent. That gives 720 words to each of the first two rows, 600 to the third and 360 to the last. A 720-word section is six or seven paragraphs, which is far more than most students plan for the contributing-factors analysis, and that is usually one of the two heaviest rows. Seeing the number first prevents the familiar shape where two thirds of the paper narrates the incident.
Where a diagram is permitted, it can carry material the prose would otherwise spend 200 words on, but only if the prose then interprets it. A figure that appears and is never mentioned again scores as decoration.
The passes of a safety event analysis
The dominant deliverable here is an event taken apart and put back together as a system finding. Work it in passes, each one answering a different question.
| Pass | What it produces | The version that stalls |
|---|---|---|
| Timeline | What happened in order, with times, roles and what each person knew at that moment. | A narrative summary with the sequence blurred. |
| The deviation | The point where the process departed from what was intended, named precisely. | A general statement that protocol was not followed. |
| Contributing factors by layer | Factors sorted into task, equipment, environment, team, training and policy, so the pattern is visible. | An undifferentiated list where staffing sits next to a broken pump. |
| The missing defence | Which barrier should have caught this and why it was absent, weak or bypassed. | The conclusion that someone should have checked more carefully. |
| Actions, ranked by strength | Corrective actions ordered from those that remove the hazard to those that rely on people remembering. | Education and a new reminder, which sit at the weak end of every hierarchy. |
| Measurement | What you will count, over what denominator and window, to know the change held. | A plan to monitor for improvement. |
| Duties afterwards | What is owed to the patient, the staff involved and the organization, including disclosure and support. | Silence about everyone except the patient. |
Evidence craft in safety writing
Safety literature is full of numbers that look authoritative and mean different things.
Rates need their exposure base. Harm figures are usually expressed against patient days, procedures, doses or admissions, and swapping one base for another changes the answer. "Four events per 1,000 patient days over two quarters" is usable. "Four events" is not, and a grader in this course notices immediately.
Design before finding, always. Improvement literature is dominated by uncontrolled before-and-after work, which supports "was followed by" but not "caused". Where the design is interrupted time series or a controlled comparison, say so, because it earns your verb the right to be stronger.
Guidance carries a date and an issuer. A safety standard, an alert or a recommended practice should be cited by the body that issued it and the version in force. Improvement guidance is revised often and a superseded document undermines an otherwise sound analysis.
Separate incident counts from incidence. Reported events measure reporting as much as harm. If your paper uses internal report counts, say that reporting culture affects them, then use them for pattern rather than for magnitude.
Passing and strong in a safety course
A passing paper is complete and humane. It describes the event, identifies what went wrong, recommends training and vigilance, and never says anything indefensible. What it does not do is change the odds. If the same staff faced the same shift again, nothing in the paper would stop the event repeating, and experienced graders read for exactly that.
A strong paper reaches a system finding and then acts on it. It picks actions that work whether or not anyone is paying attention: a forcing function, a default changed, a step removed, an order set adjusted, a supply relocated. It says what each action costs and who has to agree. It sets a measure with a denominator and a review date. And it treats the staff involved as people the organization also owes something to, which reads as maturity and is genuinely part of modern safety practice.
Six habits that cost marks in NR-584
- Stopping at the person. An analysis that ends with an individual's lapse has not answered the question the course exists to teach.
- Recommending re-education first. Education is the weakest action in every hierarchy. It can appear, but never alone and never at the top.
- Skipping the timeline. Without times and roles the contributing-factors section has nothing to attach to, so the analysis reads as speculation about people rather than a finding about a process.
- Numbers with no exposure base. Counts without patient days, doses or admissions behind them cannot be compared to anything, including the same unit last quarter.
- Identifying people or sites. Roles, unit type and approximate size are enough. Names, dates and employers are a risk with no grading upside.
- Posting a discussion response unfinished. Posts do not reopen once submitted at Chamberlain, so the first paste is the graded one.
Questions NR-584 students ask
Can I write about an event I was personally involved in?
My example was a near miss with no harm. Does that still work?
How do I write a measurement plan when I cannot get real data?
Where NR-584 sits in Chamberlain's programs
Open the exact program map for sequence, credit, and option context. The current student schedule and syllabus remain authoritative after transfer evaluation, electives, state rules, and approved plan changes.
The weeks, one by one
Week 1
NR-584 Week 1 is where a quality and safety course teaches you to say what went wrong in language that survives being read by someone who was not there. Read the full Week 1 manual.
Week 2
NR-584 Week 2 is where the course teaches you to write about a mistake in a way that produces a change instead of a disciplinary file. Read the full Week 2 manual.
Week 3
NR-584 Week 3 turns a described problem into something countable. Read the full Week 3 manual.
Week 4
NR-584 Week 4 is where the middle of a quality course usually turns from describing a problem to arguing for a specific change. Read the full Week 4 manual.
Week 5
NR-584 Week 5 is where a quality course usually stops diagnosing and starts designing. Read the full Week 5 manual.
Week 6
NR-584 Week 6 is where a quality course turns to the two analytic documents every safety program runs on: the backward-looking analysis of something that already happened, and the forward-looking analysis of something that has not happened yet. Read the full Week 6 manual.
Week 7
NR-584 Week 7 is where a tested change has to become something an organization can keep. Read the full Week 7 manual.
Week 8
NR-584 Week 8 is where the separate documents of the session become one case. Read the full Week 8 manual.