NR-542 Managing Data and Information carries three theory credits and uses information technology and the data, information, knowledge and wisdom model to build and exploit data sets. The graded writing is not about opinions supported by data. It runs the other way: you describe a set of records honestly, show what turns those records into information, and only then say what anyone should do. Papers lose points at the first step far more often than the last.
What NR-542 actually grades
The climb. Every deliverable in this course is scored on whether each level of the model is actually earned rather than announced. Data is what was recorded, with its fields and its flaws. Information is data placed in a context that answers a question. Knowledge is a pattern you can defend across records. Wisdom is a decision made with the limits in view. A paper that names the four levels in the introduction and then writes an opinion piece has satisfied nothing, and graders in this course are unusually quick to spot it because the model gives them a checklist.
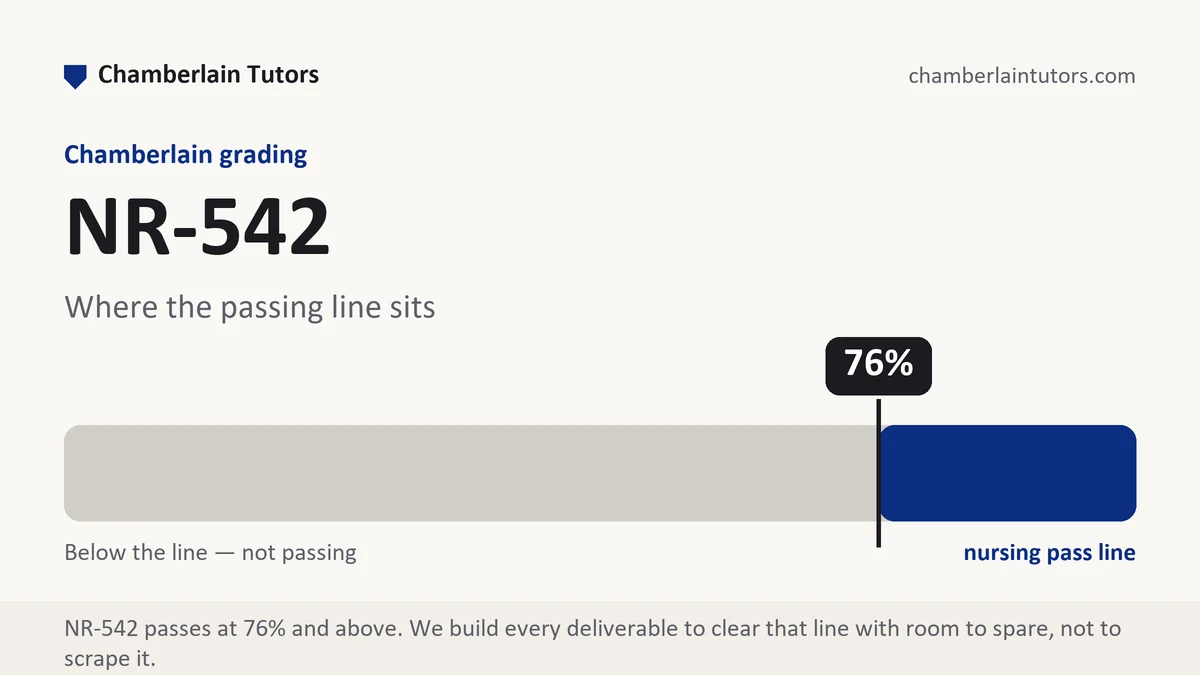
The second axis is honesty about the set itself. Rubric rows that mention data quality, integrity or governance are asking whether you looked at what you were given before you interpreted it. Chamberlain's 76 percent floor applies across core nursing courses, and the eight-week rhythm means a weak week is on your average before you have finished reading the feedback. Supplementary work does not repair a weighted average, so the recovery has to come from the graded pieces themselves.
How we help in this course
We draft data set analyses, data quality write-ups, governance and stewardship papers, standardized terminology discussions, dashboard and reporting critiques, board responses and the session project. Our drafts keep the four levels visibly separate, so a grader can point at the sentence where each one begins.
We build from the file, extract or scenario you provide and from published sources you can cite. We do not pull records from your employer's systems, request access on your behalf, or handle protected data. If your section supplies a practice data set, send it with the prompt and we work inside it.
In NR-542 right now?
Send the data set or scenario plus the rubric from Canvas. First premium sample free, floor-checked, back in 24 to 48 hours.
Read the rubric before the prompt
Data assignments look like technical work, so students open the file first and the guide last. Reverse it. Pull the criterion rows into a blank document and cut each to its verb: describe, assess, transform, interpret, recommend. Those verbs are your headings, and in this course they usually map one to one onto the levels of the model, which means the guide has already written your outline if you let it.
Now turn the weights into words. Take a 1,600 word brief with four rows at 45, 25, 20 and 10 percent. That is 720 words for the first row, 400 for the second, 320 for the third and 160 for the last. When the 45 percent row is describe and assess the data, 720 words go to the set itself: where it came from, what each field holds, what is missing, what looks wrong. Students find this uncomfortable because it feels like preamble, and then they write 900 words of recommendation against a row worth 160. Title page, references and any appendix table sit outside the count unless your guide says otherwise.
Write the four numbers beside the headings and audit them at 60 percent of the draft, not at the end. If the description section is short, the usual cause is that you have not opened the file properly rather than that there is little to say.
The shape of a data and information brief
Whatever your section calls it, the dominant deliverable here is a written brief that walks one set of records up the model. These are the parts a grader looks for.
| Part | What it must contain | What a weak version does |
|---|---|---|
| The question, stated as a data question | Something the records could answer or fail to answer, phrased so a yes or no is possible. | A topic area with no answerable question in it. |
| Provenance of the set | Source system, extract date, date range covered, number of records, unit of the row. | A file named without saying what one row represents. |
| Field inventory | Each field used, its type, its allowed values and who enters it. | A screenshot of column headers. |
| Quality assessment | Missingness, duplicates, impossible values, inconsistent coding, and what each does to the answer. | A sentence stating the data appeared accurate. |
| Data becoming information | The grouping, filter or comparison applied, stated precisely enough to repeat. | A chart with no description of how it was built. |
| The knowledge claim | The pattern you are willing to defend, with its size and its limits. | A restatement of the chart in sentences. |
| The decision | What someone should now do differently, and what would have to be true for that to be wrong. | A recommendation for further monitoring. |
Evidence and citation craft at this level
Data work has its own version of citation discipline, and four habits carry it.
Currency means the extract date, not the publication date. Where your guide sets no rule, five years is a fair line for literature, but a data set carries two clocks: when the records were created and when the extract was taken. Write both. A report published this year on records pulled three years ago is a different document from what its cover suggests, and naming the gap is a mark of someone who has handled real extracts.
Say how the record was produced before you use it. Administrative billing records, clinical documentation and survey responses are three different kinds of evidence sitting in similarly shaped tables. Eight words of setup, such as coded at discharge for billing rather than clinical review, prevents the most common misreading in this course, which is treating a coding artifact as a clinical finding.
Verbs the query can pay for. A query result is a description, not a study. It supports occurred more often among and rose across the period; it does not support caused, reduced or improved, because nothing in a filtered table controls for anything. Where your guide asks for a recommendation, write the causal claim as a hypothesis to be tested rather than a finding already made.
Denominator and window on every count. A raw count is close to meaningless in this course. Write 148 events among the 6,300 encounters recorded between January and June rather than 148 events, and state whether the denominator is patients, encounters or days, since the same numerator over three different denominators produces three different arguments. Where you compare two groups, say out loud whether the denominators were built the same way.
What separates a passing brief from a strong one
A passing brief describes a set, produces a chart, and recommends something sensible. It moves up the model in name and scores in the high seventies or low eighties, because the description is thin and the interpretation therefore floats. The tell is a paper in which nothing about the data is inconvenient.
Strong briefs do three things. They state what one row represents in the first paragraph and never contradict it, which sounds trivial until you read a paper that switches silently between patients and encounters halfway down. They name at least one real defect in the set, quantify it, and carry it forward into the interpretation, so the reader can see the claim being made with the flaw in view rather than despite it. And they write the transformation precisely enough that another student could rebuild the number: which records were excluded, on what rule, leaving how many. Reproducibility is the graduate-level marker in a data course, and it costs three sentences.
Mistakes that cost points here
- Defining the model instead of using it. Four definition paragraphs at the top is the most expensive throat clearing available in this course. Show the climb, do not narrate it.
- Never saying what a row is. If the reader cannot tell whether a row is a patient, a visit or a lab result, every rate in the paper is unverifiable.
- Reporting a count with no denominator. Numerators alone cannot be compared to anything, including the same unit last quarter.
- Skipping the missing values. A field that is blank in a third of rows changes every conclusion drawn from it, and quantifying that gap is usually worth more than the conclusion.
- Pasting a dashboard image as the analysis. A visual is an exhibit. The rubric rows are scored on the sentences that explain how it was built and what it excludes.
- Any identifier surviving into the submission. Sample rows, screenshots and appendix tables all need names, record numbers and dates of birth removed before the file leaves your machine.
Questions NR-542 students ask
Do I need a real data set, and where do I get one?
How do I use the data to wisdom model without writing four definition paragraphs?
What counts as a data quality problem worth writing about?
Where NR-542 sits in Chamberlain's programs
Open the exact program map for sequence, credit, and option context. The current student schedule and syllabus remain authoritative after transfer evaluation, electives, state rules, and approved plan changes.
The weeks, one by one
Week 1
NR-542 Week 1 installs the model the rest of the session runs on: data, information, knowledge and wisdom, treated as four levels you have to earn rather than four words you name in an introduction. Read the full Week 1 manual.
Week 2
NR-542 Week 2 asks where the records came from. Read the full Week 2 manual.
Week 3
NR-542 Week 3 is about the difference between recording something and recording it in a form that can be counted. Read the full Week 3 manual.
Week 4
You take a set of records and interrogate it on named quality dimensions before you interpret anything: completeness, accuracy, consistency, timeliness, validity and uniqueness. Read the full Week 4 manual.
Week 5
A data set that answers a question rarely arrives as one file, so this stage works on how records are structured, how identifiers link one table to another, what changes when you combine them, and what the unit of analysis has to be for your question. Read the full Week 5 manual.
Week 6
NR-542 Week 6 is the level change from data to information: the operations that put records in a context where they answer something, and the presentation choices that decide what a reader takes away. Read the full Week 6 manual.
Week 7
NR-542 Week 7 asks who owns the meaning of a number. Read the full Week 7 manual.
Week 8
NR-542 Week 8 closes the session with the top of the model: a decision, made from a defensible pattern, carrying its own limits. Read the full Week 8 manual.