NR-518 carries four theory hours, more than most courses in the sequence, and the extra credit is doing real work. This is population focused nursing built on the levels of prevention plus epidemiological principles and methods. That second half means measurement: rates, denominators, study designs and the difference between a number that describes a population and a number that explains one.
What NR-518 actually grades
Two abilities, and students usually arrive with one of them. The first is prevention thinking: taking a health problem and sorting interventions into primary, secondary and tertiary levels without blurring the categories, which is harder than it sounds because screening and early treatment sit close together and get mixed constantly.
The second is epidemiological literacy. You are expected to read and write about incidence and prevalence without swapping them, to say what a rate is measuring and over what period, and to recognize which study design produced a claim. When a rubric row asks you to analyze a population health problem, that row is asking for numbers handled correctly, not for concern expressed fluently.
The four hour weight usually shows up as heavier weekly reading and longer deliverables. Plan the calendar accordingly rather than treating it as another three hour course sitting in the same session.
How we help in this course
NR-518 is a theory course with no clinical hours, so nothing on our side touches placement, preceptors, site paperwork or hour logs.
Send the week's prompt and its rubric from Canvas and a premium original draft returns in 24 to 48 hours, built against the criterion rows, with every rate carrying its denominator and every study described before its finding appears. Two quality reviews and the floor check run before it ships, and revision runs free until the paper lands.
Writing this course's deliverables from the rubric
Rubric, population, numbers, then prose. The most common wasted evening in this course is spent writing eloquently about a health problem before checking whether the data to support the analysis rows actually exists for that population.
In NR-518 right now?
Send the week and the rubric from Canvas. First premium sample free, floor-checked, back in 24 to 48 hours.
The floor under a four credit course
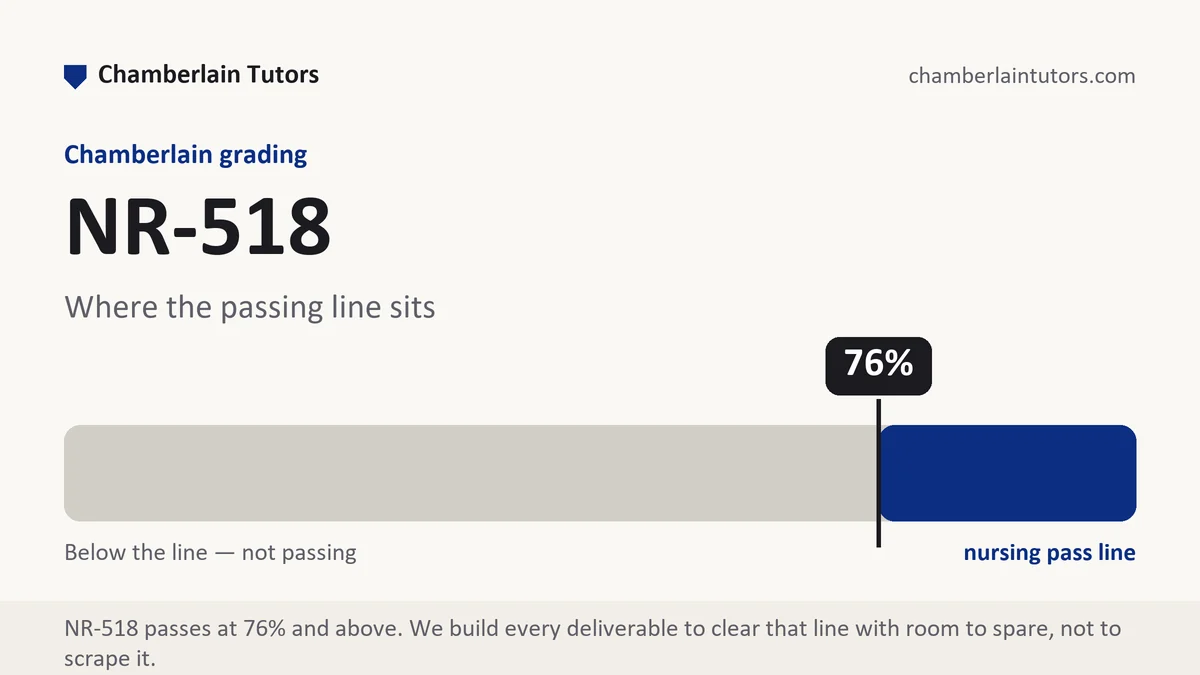
Core nursing courses pass at 76 percent, and on the nurse practitioner specialty scale, which has no C band, the last passing number is 84. A four hour course carries more weight in the term average than the three hour courses around it, which cuts both ways: a strong grade here does real work, and a weak one is expensive.
Chamberlain runs sixteen week semesters split into two eight week sessions with up to six starts a year, and deliverables arrive weekly. Supplementary work cannot rescue a weak weighted average, so the extra reading load has to be absorbed in the first fortnight rather than deferred.
Turn the criterion rows into a section plan
Copy the rows into a blank file in printed order and reduce each to its verb: describe, calculate, analyze, apply, evaluate. Those verbs become headings, and holding the guide's sequence means a grader working down the rows keeps meeting the section they expected next.
Then convert weights into words, which matters more here because the assignments are longer. Say the paper is capped at 2,000 words with four rows weighted 30, 30, 25 and 15 percent. That is roughly 600 words, 600, 500 and 300. Two rows at equal top weight is a warning shape: one of them is usually the epidemiological analysis and the other the prevention application, and students almost always write the prevention section fully and the epidemiology section in a rush. Six hundred words of epidemiology is a genuine treatment of measures, sources and limits, not a paragraph with two statistics in it.
Keep the number beside each heading while drafting. Title page and references sit outside the count unless your guide says otherwise, and a data table usually does as well, which makes tables an efficient way to carry figures without spending prose on them.
The shape of an epidemiological analysis
Most graded writing here is an analysis of a health problem in a defined population. These parts recur, and a grader is looking for each of them.
| Part | What it has to establish | How the thin version reads |
|---|---|---|
| The population, bounded | Who is in it, where, and over what period, so every later number has a denominator. | A vague group such as older adults in America. |
| Burden, measured | Incidence and prevalence used correctly, each with its source, base and time window. | Two statistics with no indication of which is which. |
| Distribution | Who inside the population carries more of the burden, by place, age, occupation or exposure. | A single overall figure treated as the whole story. |
| Determinants and risk | What is associated with the outcome, with the study design behind each association named. | Risk factors listed from memory with no sources. |
| Levels of prevention | Interventions sorted into primary, secondary and tertiary, each matched to a point in the disease course. | Three headings with the same kind of intervention under each. |
| Limits of the data | What the surveillance source misses, who is undercounted, and how that bends the picture. | Numbers presented as though complete. |
Evidence and citation craft in epidemiology
This is the course where careless numbers are most visible, because the subject is numbers.
- Surveillance data ages fast; date every figure. Say which year the estimate describes and which year it was published, since those differ. Where a figure is older than five years, put the reason it still stands into the sentence.
- Cite the data source, not the article quoting it. National surveys, registries and vital statistics publish their own tables. Going to the source lets you report the base and the collection period, which the secondary account almost always drops.
- Design and sample before every finding. Write that a case control study compared 340 people with the outcome against 680 matched controls, then the association. In epidemiology the design is not background, it is the thing that determines what the number can mean.
- Match the verb to the design. Cohort and case control work supports was associated with and occurred more often among. Only controlled experimental designs support caused and reduced. A single misused verb undermines an otherwise careful analysis in this course specifically.
- Denominator and window on every rate, without exception. Write that 46 new cases occurred among the 12,000 residents during a two year period, rather than that the rate was 3.8 per thousand and leaving the reader to reconstruct it. Then say whether the number is incidence or prevalence, because the two answer different questions and are swapped constantly.
The gap between a passing paper and a strong one
A passing NR-518 paper picks a real problem, reports accurate statistics, and lists prevention strategies at three levels. It looks like a good public health leaflet, and a leaflet is the ceiling it reaches.
Strong papers do three additional things. They compare rather than report, showing how the burden differs between groups or places, because a difference is what an analysis can explain. They name the limits of their own data, saying who is missing from a registry or a survey and which direction that bends the estimate. And they connect the prevention level to the point in the disease course it acts on, so that a screening programme is placed where it belongs rather than wherever it sounded right.
Six mistakes that cost points here
- Swapping incidence and prevalence. The single most reliable way to lose a row in this course, and the easiest to fix by writing new cases or existing cases in your own draft notes.
- Rates with no base. A percentage with no denominator and no period is not a measurement, and in an epidemiology course it is marked as one.
- Prevention levels blurred. Screening asymptomatic people is not the same as treating early disease. Anchor each level to what has already happened to the patient.
- National figures for a local problem. If the population is a county, national estimates are context rather than evidence. Say which you are using.
- Causal verbs on observational findings. Association is what most of your sources supply, and writing it accurately is scored.
- Posting to the board from the text box. Chamberlain posts cannot be edited once submitted, and a mistyped statistic is permanent. Draft elsewhere and check the numbers before pasting.
Questions NR-518 students ask
Do I need to calculate rates myself, or can I quote published ones?
Which data sources are considered strong enough?
How do I handle a population where the data is genuinely poor?
The weeks, one by one
Week 1
Bedside nursing acts on the person in the bed; population-focused nursing acts on a group defined in advance, and the opening stage of a four theory hour course teaches the framework that carries every later deliverable: what makes a nursing intervention population-focused, and how primary,. Read the full Week 1 manual.
Week 2
NR-518 Week 2 asks where health is actually produced, and the answer sits mostly outside the clinic. Read the full Week 2 manual.
Week 3
NR-518 Week 3 is where the epidemiological half of the course starts paying rent. Read the full Week 3 manual.
Week 4
NR-518 Week 4 asks where your numbers came from before it asks what they mean. Read the full Week 4 manual.
Week 5
NR-518 Week 5 turns from counting to explaining. Read the full Week 5 manual.
Week 6
NR-518 Week 6 puts the methods of the earlier stages under a clock. Read the full Week 6 manual.
Week 7
NR-518 Week 7 takes the one activity in population health that offers a test to people who feel completely well, and asks what that offer actually delivers. Read the full Week 7 manual.
Week 8
NR-518 Week 8 is where the session's separate skills are asked to do one job together. Read the full Week 8 manual.
Where NR-518 sits in Chamberlain's programs
Open the exact program map for sequence, credit, and option context. The current student schedule and syllabus remain authoritative after transfer evaluation, electives, state rules, and approved plan changes.