The middle of the session is spent assembling numbers from sources that were never built to sit beside each other. Population data comes from surveys with sampling error, from vital records with near-complete coverage, from administrative billing files that record what was paid for rather than what happened, and from local reports with their own definitions. This stage is graded on provenance: naming each source, its collection method, its geography, its year, and the specific ways it does and does not describe your population. Your section may print this as NR 538 or NR538; it is the same course. Chamberlain publishes no syllabi outside Canvas. The placement here is our teaching judgment from the course's catalog arc; your section's rubric decides what your week actually asks.
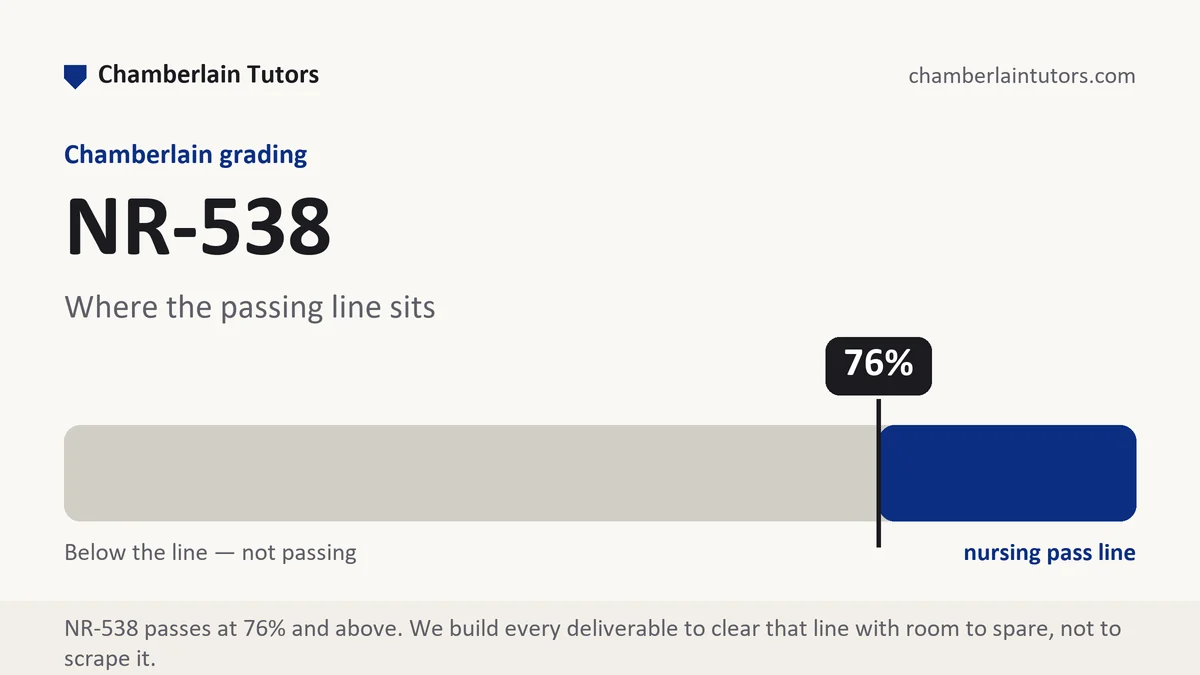
What NR-538 Week 3 asks for
Two numbers about the same county sat in one student's draft and contradicted each other. A state hospital association file reported readmissions among older adults discharged to post-acute settings for one fiscal year; a county health report gave a different figure for what appeared to be the same thing in the same period. Neither was wrong. One counted returns to any hospital within thirty days including planned admissions, and it counted the hospital's location; the other counted unplanned returns only and attributed each case to the patient's county of residence. The task in this stage is exactly that kind of reconciliation, done in prose, so that a reader knows which number answers which question rather than being handed both and left to guess.
The territory covers four families of source. Population denominators and social characteristics come from census products and large ongoing surveys, with sampling error that matters at small geographies. Health outcomes come from vital statistics, disease registries and surveillance systems, each with a defined case definition and a reporting lag. Service use comes from administrative and claims data, which is complete for what was billed and silent about what was not. And local knowledge comes from health department assessments, coalition reports and service directories, which are current and specific but rarely comparable across places.
Two technical distinctions will be graded. The first is primary versus secondary data: whether you collected it for this purpose or are reusing something collected for another. Nearly everything in this stage is secondary, and secondary data has to be interrogated for the purpose it was originally built to serve. The second is the difference between a count, a rate and an estimate with a margin of error. A survey estimate for a small county can carry an interval wide enough to make two areas indistinguishable, and reporting the point estimate alone hides that.
Deliverables here are typically a data collection matrix plus narrative, sometimes an annotated source list. Where a discussion runs, expect a prompt about data gaps in your population. Answer it with a specific missing measure and the reason it is missing, rather than with a general statement that more data would help.
The NR-538 Week 3 method, step by step
Six moves for assembling data you can defend.
-
Build the matrix before you start collecting
Columns for measure, source, geography, year, collection method, and limitation. Filling a structured grid stops the collection turning into whatever the first search returned.
-
Record the case definition alongside every health measure
What counts as a case, over what interval, attributed to which place. Two sources disagreeing usually differ here rather than in accuracy, and the definition is what lets you say so.
-
Check the geography of attribution, not just the geography of reporting
Data can be attributed to where a person lives or to where a service is located. For care transitions the two diverge sharply, since facilities draw from a wider area than their own ZIP code.
-
Note the collection year and the lag together
A figure from three years ago describing conditions before a facility closed is evidence about a period, not about now. Say which period each number describes.
-
Carry margins of error through to your sentences
Where a survey estimate publishes an interval, report it. At small geographies the interval often decides whether a difference you want to discuss exists at all.
-
Write the gap list as findings, not apologies
Name the measures you could not obtain, why they were unavailable, and what would have to happen for them to exist. Suppression rules, small counts and unmeasured domains are results about the data system.
Layout and word budget for a data collection report
Our frame for a sourced data submission with a matrix attached, sized for roughly 1,200 to 1,500 words of prose. It is our own outline rather than anything the university issues, and your week's rubric outranks it wherever they disagree.
| Section | What belongs in it | Word target |
|---|---|---|
| Collection approach | Which domains you set out to fill, in what order, and the search strategy that produced the sources. | 150 to 190 |
| Demographic and social layer | Denominators and social characteristics with their source, year and sampling basis stated in the sentence. | 230 to 280 |
| Health outcome layer | Outcome measures with case definitions, reporting lag and the surveillance or vital records system behind each. | 250 to 310 |
| Service use layer | Administrative or utilization figures, what they capture, and what activity they are structurally blind to. | 200 to 250 |
| Reconciliation | Any two sources that disagree, the definitional reason, and which one answers which question. | 200 to 260 |
| Gaps and provenance limits | Missing measures, suppression, and the specific limits your later analysis will have to respect. | 170 to 220 |
Evidence craft for secondary data writing
Attribute the dataset, not just the website. Name the agency, the program that produces the data, the edition or year, and the geography level. A citation that points only at a portal leaves the reader unable to find the same table twice.
Report the count and the denominator in the same sentence. Sixty-two events among an estimated 41,300 residents aged 65 and over during one calendar year is a defensible sentence. A rate with no denominator invites a question you have already answered but not written.
Distinguish estimate from enumeration. Survey figures are estimates with error; vital records are close to complete counts for the events they capture. Using the same flat language for both is the most common provenance error in this stage.
Treat a data gap as a finding about the system. When a measure is suppressed because counts are small, that tells the reader something real about the population's size and about what any monitoring plan will be able to see. Write it as evidence rather than as an excuse.
Five mistakes that cost points in this week's territory
- Numbers with no year. A figure floating free of its collection period cannot be interpreted and cannot be compared with anything.
- Mixed geographies presented as one picture. A state rate beside a ZIP code count beside a facility figure is three different questions answered in one paragraph.
- Administrative data read as clinical truth. Billing records describe what was coded and paid for, and treating that as a complete account of care overstates what the data can support.
- Point estimates from small area surveys. Reporting a percentage from a small geography without its interval invites conclusions the data cannot bear.
- Data dumping. A parade of statistics with no organizing structure abandons the framework chosen in the previous stage and reads as compilation rather than assessment.
Before you submit
- Every measure carries source, geography, year and collection method
- Case definitions appear for each health outcome
- Attribution geography is stated where residence and service location differ
- Counts and denominators travel together throughout
- At least one source disagreement is reconciled by definition rather than by choosing a favourite
- The gap list names specific missing measures and the reason each is missing
Assembling data for NR-538?
Send the prompt and the scoring guide out of Canvas. A premium original draft comes back in 24 to 48 hours with every figure carrying its source, base and period and every mismatch reconciled in the prose, and revisions run until the grade lands.