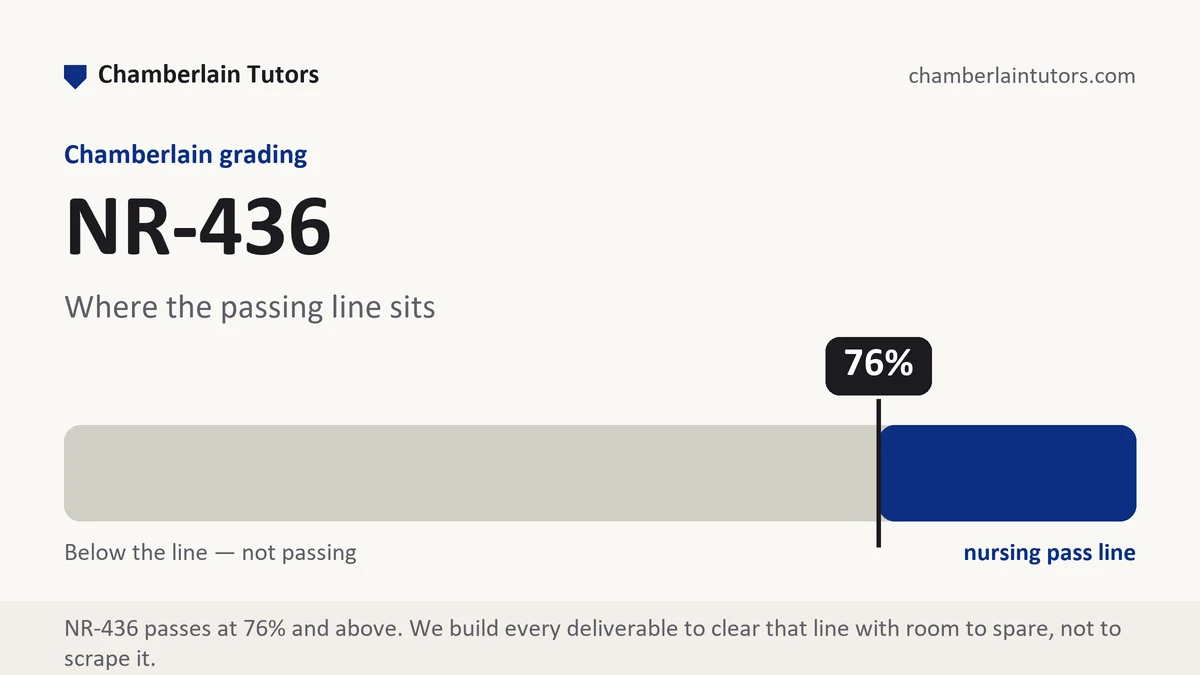
NR-436 Week 2 usually belongs to epidemiology: rates, incidence and prevalence, surveillance, and the discipline of reading a community's numbers before forming an opinion about its health. The written work at this stage rewards students who can pull a real figure from a public data source, say what it counts and over what period, and compare it against a benchmark without mangling the arithmetic. Your section may print this as NR 436 or NR436; it is the same course. Chamberlain publishes no syllabi outside Canvas. The placement here is our teaching judgment from the course's catalog arc; your section's rubric decides what your week actually asks.
What NR-436 Week 2 asks for
A school nurse reviewing an immunization record audit finds that 61 of 480 enrolled children are missing at least one required dose. Whether that number is an emergency or background noise depends entirely on comparison: last year's count, the district's other schools, the state figure. Epidemiology is the set of habits that turns 61 into a judgment, and this week's writing asks you to demonstrate those habits on paper with a real community's data in front of you.
The likely deliverable shapes at this stage are a data-reading exercise, a short paper interpreting community health indicators, or a discussion post analyzing a rate from a public source. Whatever your section assigns, the graded skill is the same: distinguishing incidence from prevalence, quoting rates with their denominators and time windows, and resisting the pull to explain a number before establishing what it actually measures. If a post is due this week, verify every figure against its source before submitting, because a misquoted rate in a data week is the most checkable error a grader will ever see.
The pre-licensure register matters here. You are not being asked to run analyses or critique study methodology at a graduate level. You are being asked to read published numbers accurately and connect them to nursing action: which figure justifies a screening program, which trend suggests an outbreak, which comparison identifies the population a nurse should reach first. Keep the writing at the level of accurate reading and sensible implication, and it will score better than borrowed statistical vocabulary ever does.
For a 48-hour clinical section, this is also the week to let data choose where your attention goes. With limited hours, students who arrive at their clinical activities already knowing the community's three worst indicators see more in every encounter than students discovering the numbers afterward. Read your county's profile before your next clinical day and carry one question from it with you. The hours themselves and whatever your site requires of you remain your own real work; the preparation is what makes the written layer specific.
The NR-436 Week 2 method, step by step
Six moves for writing about community data without losing points to arithmetic.
-
Pull your figures from the primary public source
Go to the county or state health department page, or the national survey table, rather than a news story summarizing it. Record the exact figure, its units, its year, and its geography before you write a word around it.
-
Classify every number before interpreting it
For each figure, write privately whether it is a count, a rate, incidence, or prevalence, and over what window. Half the errors graders mark in data weeks are category errors: prevalence discussed as if it were new cases, counts compared across differently sized populations.
-
Give every rate a comparison partner
A rate alone is a fact; a rate against the state figure, the national figure, or the same community five years earlier is analysis. Choose one comparison per number and name it in the same sentence.
-
Write the descriptive triad: person, place, time
Who is affected, where, and when is the oldest organizing frame in epidemiology and it still structures a paragraph perfectly. Run your community's problem through all three and patterns surface almost mechanically.
-
Translate the pattern into one nursing implication
End each data paragraph by saying what a community health nurse would do differently because of it: screen earlier, target a zip code, time a campaign. Data without implication reads as a report; this course grades analysis.
-
State the data's limits in one honest sentence
Small counts jump around, surveys lag, and some conditions are undercounted. One sentence naming the weakness of your best figure shows the grader you read numbers rather than just relaying them.
A layout and word budget that keeps the numbers honest
Our frame for a data-interpretation piece of roughly 900 to 1,100 words. It is our own outline rather than anything the university issues, and your week's rubric outranks it wherever the two disagree.
| Section | What belongs in it | Word target |
|---|---|---|
| The question the data answers | What you wanted to know about the community, stated before any figure appears. | 70 to 90 |
| Sources on the table | The two or three public sources used, each with its year, geography, and what it measures. | 120 to 150 |
| The figures, classified | Each number presented with its type, base, and window, in prose a non-statistician could follow. | 220 to 260 |
| Comparison and pattern | Every figure held against a benchmark, and the person-place-time pattern the comparisons reveal. | 230 to 270 |
| Nursing implication | What the pattern tells a community health nurse to do first, for whom, and where. | 150 to 180 |
| Limits and next data | The weakest figure named honestly, and what better data would settle. | 90 to 110 |
Evidence craft that survives a fact-check
Quote figures exactly and cite where each lives. Rounding 14.7 to about 15 is fine in conversation and costly in a data week, because graders in these stages spot-check. Keep a private file linking every number in your draft to the page it came from, and the fact-check holds itself.
Never compare counts across different-sized groups. Two hundred cases in a city and forty in a town says nothing until both become rates per the same base. If you convert anything yourself, show the base you used in the sentence so the reader can retrace the step.
Date every figure inside the sentence. Community indicators move, and surveillance data lags by a year or more. A prevalence quoted without its year invites the one question a grader asks that you cannot answer after submission.
Keep clinical anecdotes as illustration only. If your clinical day showed you something the data also shows, write the data first and the observation second. In an epidemiology week, a story standing in the place of a rate is precisely the error the week exists to train out.
Five mistakes that cost points in this week's territory
- Incidence and prevalence swapped. The distinction is the week's core vocabulary, and misusing it in a data paper is the most predictable deduction in the course.
- Percentages with no base or window. Twelve percent of whom, counted over what period? A figure that cannot answer both questions cannot support a claim.
- A rate with no comparison. Calling a number high or low without a benchmark is an opinion wearing a decimal point.
- Secondhand statistics. Figures quoted from a news article or a classmate's post inherit their errors. Primary public sources exist and graders know it.
- Data described but never used. A tidy summary of the county profile with no nursing implication answers a reporting question the rubric did not ask.
Before you submit
- Every figure carries its type, base, time window, and source year in the sentence
- Each rate is compared against at least one named benchmark
- Person, place, and time are all addressed for the central problem
- Each data paragraph ends in a nursing implication
- One sentence honestly names the limits of your strongest figure
- Every number in the draft can be traced to a source you could open in ten seconds
Wrestling with community data in NR-436?
Send the instructions and the rubric out of Canvas. A premium original draft comes back in 24 to 48 hours with every rate based, dated, and compared, and revisions run until the grade lands.