NR-612 is the culminating half of the population health concluding graduate experience: 1.5 theory credits, 1.5 practicum credits and 72 practicum hours in which the evidence-based practice project you planned gets implemented and evaluated. The mistake that costs the most points here is assuming the grade tracks the result. It does not. It tracks whether you can report what actually happened, measure it against the aim you set, and say honestly what the numbers can and cannot support.
What NR-612 actually grades
The first graded strand is the account of delivery. A capstone report has to say what was done, to whom, how many times, by whom and over what dates, with the gap between the plan and the reality named rather than smoothed over. Reports that describe the intended project in the past tense lose the implementation rows, because a grader cannot tell whether anything occurred.
The second strand is the analysis. Results are scored on whether the comparison is fair: same measure, same definition, stated windows before and after, and a denominator attached to every proportion. A number without its base is not a result in this course, it is a claim.
The third strand is interpretation, and it carries the heaviest expectations. You are being asked to say what your data supports, what it does not, and what someone reading the report should do next. This is where a null result becomes an advantage: a project that did not move its measure, reported cleanly with a plausible explanation, scores above a project that reports a success it cannot defend.
How we help in this course
The limits are firm and they matter more in a capstone than anywhere else. We do not complete practicum hours, speak to a mentor or a site, sign placement paperwork, fill an hour log or sit anything on your behalf. We also cannot invent the project data, because the data has to come from what you did.
What we do is the writing. Send the scoring guide, the aim you set in the planning course and the numbers you collected, and a premium original draft returns in 24 to 48 hours: results arranged so the comparison is visible, limitations written as reasoning rather than apology, and the dissemination piece matched to the audience the guide names. Both quality passes and the floor check run before delivery, and revision stays free until it lands.
Writing this course's deliverables from the rubric
There is no published Chamberlain syllabus to build a week by week grid from, and the scoring guide arrives attached to each assignment inside Canvas rather than in advance. So what follows is the transferable part: how an implementation and evaluation report is budgeted, structured, evidenced and checked. Read it with your own guide open, and give the first drafting hour to whichever row your guide names that this page does not.
In NR-612 right now?
Send the week and the rubric from Canvas. First premium sample free, floor-checked, back in 24 to 48 hours.
The passing line, and a project that runs out of calendar
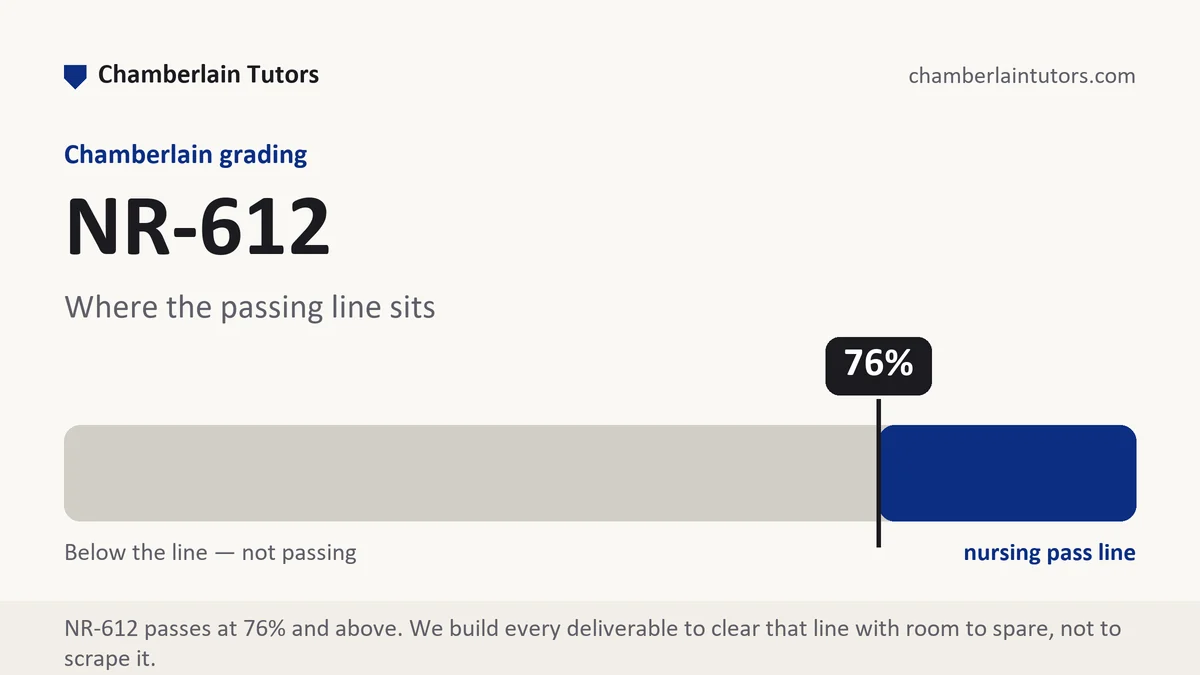
Core nursing courses pass at 76 percent. The nurse practitioner specialty scale, the one with no C band, governs NP specialty courses rather than this track, so 76 is the line here. The grade is still a weighted average and supplementary work cannot repair it, which in a capstone means the report is not rescuable by effort in week eight.
The real constraint is arithmetic. Sixteen week semesters split into two eight week sessions, up to six starts a year, and a follow up measure needs time to exist. If your intervention runs in weeks three and four, the post period is short by construction, and pretending otherwise is what produces indefensible results sections. The fix is to say so: name the window, state that it is short, and interpret inside that limit. Graders reward the sentence that owns the constraint far more than the one that hides it.
Board posts remain uneditable once submitted, and in this course they are usually where you first report a finding. A number posted wrong on Monday is still there in week eight when your report says something different, so draft posts in a document and check the figure before pasting.
Turn the criterion rows into a section plan
Take the rows out of Canvas into a blank file in printed order, then reduce each to its verb: implement, measure, analyze, interpret, disseminate. Those verbs are your headings, in the guide's sequence, so the grader meets each section where they expect it.
Then convert weight into words. Suppose the final report is capped at 3,000 words with five rows weighted 30, 25, 20, 15 and 10 percent. The budget is 900 words, 750, 600, 450 and 300. The trap here is different from the planning course: two rows sound alike, one asking what the data showed and one asking what it means. Students answer the first twice and the second never, producing a 900 word results section and a 300 word discussion that repeats it. Write the interpretation section against a separate heading, and never let a number appear in it for the first time.
Where the guide sets a page count instead of a word count, convert at roughly 275 words per double spaced page before budgeting, and check whether tables and the reference list sit inside or outside that count. Evaluation reports carry tables, and a table counted as prose can cost you 400 words of argument.
The shape of an implementation and evaluation report
Most graded writing in NR-612 is one report wearing different clothes: a progress paper, a results paper, an executive summary, a dissemination piece. These parts recur, and each is something a grader looks for by name.
| Part | What it has to establish | How the thin version reads |
|---|---|---|
| Aim restated | The measure, group, baseline, target and deadline you committed to, in one sentence, unchanged from the plan. | A general reminder that the project addressed an important problem. |
| What was delivered | The actual activity: what, to how many, on which dates, delivered by whom. | The planned intervention described in the past tense. |
| Reach and fidelity | How many eligible people received it out of how many were eligible, and where delivery departed from the plan. | A statement that the intervention was implemented as designed. |
| Measures and their source | Where each number came from, who pulled it, how the two time points were defined. | Percentages with no origin and no dates. |
| Results | Before and after with counts and denominators, process measure separated from outcome measure. | One improved percentage presented as the whole finding. |
| Interpretation and limits | What the change can and cannot be attributed to, including anything else that changed during the same period. | A conclusion that the intervention was effective. |
| Sustainability and handoff | Who owns the change now, what keeps it running, and the one condition most likely to end it. | A recommendation that the organization continue the initiative. |
Write the results section first and the aim restatement second. Restating the aim after you know the results forces you to notice quietly changed targets, which graders catch.
Evidence craft when the data is your own
A capstone asks you to appraise your own project as strictly as you appraised the literature, and the rows scoring analysis are checking exactly that.
- Denominator on every proportion. Write that 18 of the 47 people who met the criteria completed the second screening, then give the percentage. A bare 38 percent hides whether the base was 47 or 4.
- Name both windows. Baseline collected across which dates, follow up across which dates, and whether the two periods are equal in length. Unequal windows make a change uninterpretable, and saying so protects the analysis row.
- Verbs your design can pay for. A single site project with no control group supports followed, coincided with and was observed after. It does not support caused, produced or reduced, however much the number moved.
- Name the competing explanations. Staffing changes, a seasonal pattern, an unrelated organizational push, or simply being watched. Listing two plausible alternatives and explaining why yours remains reasonable is graduate appraisal.
- Keep the comparison literature current and matched. Where you compare your result against published work, the comparison holds only if the population and the measure match. A national figure calculated differently from yours is context, not a benchmark, and it should be labelled as such.
What separates a passing report from a strong one
A passing NR-612 report says the project was implemented, gives a number that improved, and concludes that the intervention worked and should continue. It reads as finished. It also cannot be checked by anyone, and rubric rows that ask for analysis rather than description put it in the middle band.
Strong reports do three things visibly. They separate the process measure from the outcome measure, so a reader can see that 34 of 40 staff received the tool even though the clinical number moved by two points. They report the disappointing result with the same detail as the good one. And they end with a named next step: one change, at one level, with the measure that would show whether it worked. That final paragraph is where a capstone stops being a school assignment and starts reading like something a unit could use.
Six mistakes that cost points here
- Reporting the plan instead of the delivery. If the reader cannot tell what physically happened and when, the implementation rows have nothing to score.
- Quietly moving the target. A goal that shifts from 65 percent to any improvement between the two courses is the single most visible integrity problem in a capstone.
- Causal language on a single site project. Attributing the change to your intervention with no comparison group loses the analysis row even when the change is real.
- Merging process and outcome measures. They answer different questions, and combining them hides the one piece of good news most projects actually have.
- Identifying the site or its patients. Keep organizations, staff and patients unidentifiable, and confirm what your site permits before publishing internal figures in a paper.
- Treating limitations as an apology. Two paragraphs of self-criticism with no consequence for the interpretation reads as filler. Tie each limit to what it changes about your conclusion.
Questions NR-612 students ask
My measure did not improve. Am I going to fail the capstone?
How much of my planning course work can I reuse here?
The site cut my project short. How do I write about that?
Where NR-612 sits in Chamberlain's programs
Open the exact program map for sequence, credit, and option context. The current student schedule and syllabus remain authoritative after transfer evaluation, electives, state rules, and approved plan changes.
The weeks, one by one
Week 1
NR-612 Week 1 is the stage where a plan written in a previous course becomes a project that is about to happen to real people, and the writing that opens the capstone is a restatement built for delivery rather than for approval. Read the full Week 1 manual.
Week 2
An early stage of the capstone session belongs to measurement, because a project that has not written down exactly what counts will not be able to say what changed. Read the full Week 2 manual.
Week 3
Once delivery is underway, the writing turns to fidelity: the account of what was actually done, to how many, by whom, and how closely it matched the specification. Read the full Week 3 manual.
Week 4
At the halfway point of a capstone session the written work turns into a status document: what has been delivered, what the early numbers look like, what has gone differently from plan, and what will be adjusted for the remaining weeks. Read the full Week 4 manual.
Week 5
The results stage asks for a fair comparison, reported without interpretation, in a form a reader can recompute. Read the full Week 5 manual.
Week 6
Interpretation is the most heavily weighted territory in a population health capstone and the one students most often under-write. Read the full Week 6 manual.
Week 7
Late in the capstone the writing turns outward: the same project has to be re-expressed for people who will not read the full report. Read the full Week 7 manual.
Week 8
The closing stage assembles everything into one report and adds the two pieces that only exist at the end: a sustainability plan saying what happens to the change after you leave, and a professional reflection tying the project to the competencies the degree claims to develop. Read the full Week 8 manual.