NR-586AT is population health and epidemiology as it runs inside Chamberlain's accelerated MSN advanced nursing leadership options. Three theory credits, no practicum. The characteristic deliverable is a needs assessment that ends in a choice: several real problems, limited resources, and a defended decision about which one the organization takes on first.
What NR-586AT actually grades
Assessing a population is the easy half. Any diligent student can assemble indicators showing that a community has more diabetes, less transport and fewer providers than the state average. The graded half is what follows: choosing, with stated criteria, which gap your organization will address, and accepting in writing that the others will wait.
Rows in this course therefore reward three things. Comparison, because a number means nothing until it sits beside another number. Explicit criteria, because a priority chosen on instinct cannot be defended to a board. And feasibility, because a leader is judged on what the organization can actually staff and fund.
The epidemiology underneath has to be handled carefully rather than elaborately. Small areas produce unstable rates, secondary data is usually two or three years old by the time you read it, and self-reported indicators measure willingness to report as much as they measure the condition. None of that disqualifies the data. It just has to be named, and naming it is what separates a leader from a spreadsheet.
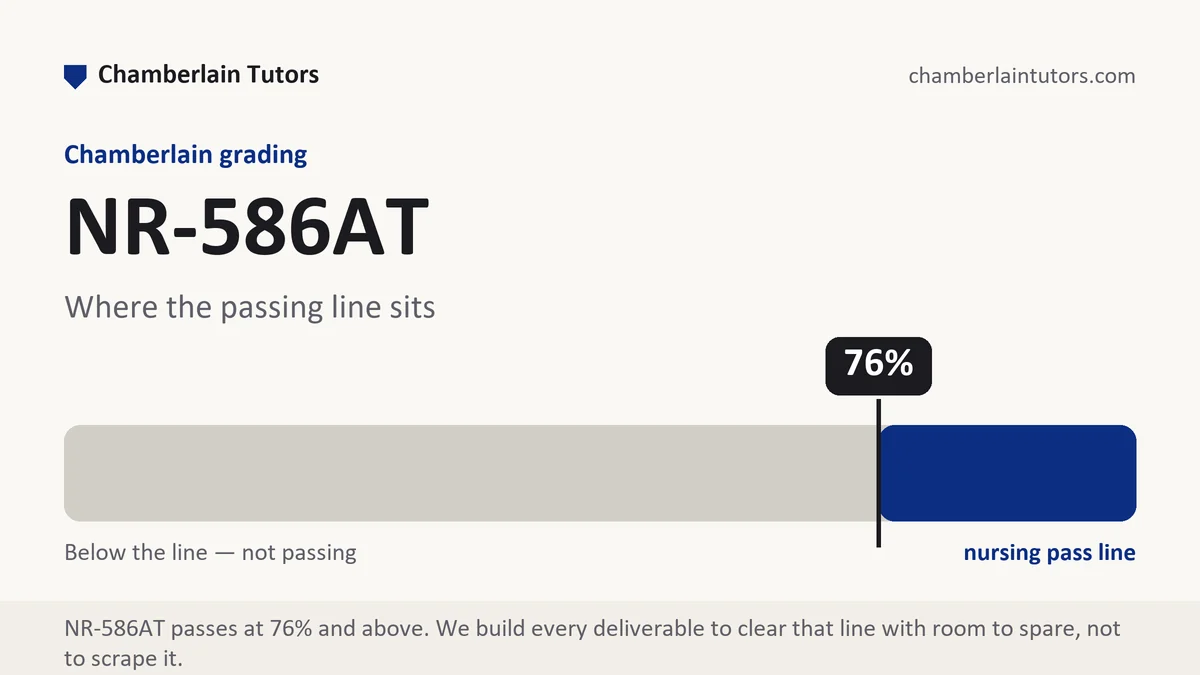
Pace is a factor as everywhere in the accelerated options. Deliverables land weekly inside an eight-week session, the passing floor in core nursing courses is 76, and supplementary work cannot rescue a weak weighted average.
How we help in this course
Send the prompt and the rubric from Canvas plus the population you want to assess: a county, a catchment, a clinic panel or a defined group inside a larger system. We assemble the indicator set from public sources, build a comparison that holds up, and write the prioritization section so the criteria are visible rather than implied.
Where the prompt asks for community engagement you cannot actually carry out, we write it as a specified plan, which is what rubrics at this level normally expect, and we mark clearly which inputs are proposed rather than gathered.
Writing the needs assessment?
Send the rubric and the population. We will build the indicator set and the comparison today.
Read the rubric before the prompt
Sort the criterion rows by what they need in order to be satisfied: a number, a judgment, or a plan. Number rows are the ones to plan the assignment around, because they constrain which population you can choose. Judgment rows are where the top band is decided. Plan rows are usually the cheapest to complete well, since they reward specificity rather than research.
Then price them. A 1,000-word cap with rows weighted 45, 25, 20 and 10 percent gives 450, 250, 200 and 100 words. Four hundred and fifty words on one row means the rest of the document is tight enough that background has to go entirely. This is where the accelerated format bites: there is no room to show everything you read, so the reading has to be converted into a small number of load-bearing sentences.
If a table is allowed outside the word count, put the indicators in it. Prose that recites six figures burns 150 words and is harder to read than the table it should have been.
The steps of a needs assessment that ends in a decision
The dominant deliverable here moves from a defined population to a commitment. Each step feeds the next.
| Step | What it must deliver | The version a board sends back |
|---|---|---|
| Population defined | Geographic or panel boundaries, size, and the age and income profile that shapes everything after. | A community described by name only, with no size attached. |
| Indicators assembled | Five or six measures with their source, year and denominator, chosen because they connect to services you could provide. | Twenty indicators copied from a public dashboard. |
| Comparison drawn | Each indicator set against a state, national or peer figure, with the gap stated in plain numbers. | Local figures presented alone, so the reader cannot tell what is unusual. |
| Community voice | What people in the population say the problem is, gathered or specified as a plan, and where it disagrees with the data. | An assumption that the indicators speak for the residents. |
| Prioritization criteria | The stated tests you applied: size of the gap, severity, feasibility, existing capacity, equity impact. | A priority announced with no criteria, so it looks like a preference. |
| The commitment | The one problem the organization takes on, and an explicit note about what is being deferred. | Three priorities, which in a resource-limited setting means none. |
| Service response | What would be offered, by whom, at what volume, and where it sits in existing operations. | A recommendation to increase awareness and outreach. |
| Accountability | The measure, the reporting interval and the person who answers for it. | A plan to reassess in future. |
Evidence craft with secondary data
Almost everything in this deliverable comes from data somebody else collected for another purpose, which creates specific obligations.
Cite the year of the data, not the year of the page. A dashboard updated last month may be displaying figures from three years ago. Say which, since a stale denominator quietly invalidates every rate built on it.
Small numbers move. In a small area, a handful of extra events swings a rate dramatically. Where counts are low, say so and lean on multi-year figures rather than treating a single year as a trend.
Comparison groups have to be fair. Comparing a rural county to a state average that is mostly urban tells you about geography as much as about health. Name the mismatch or pick a peer comparison, and say which you did.
Verbs and denominators. Cross-sectional community data supports "was more common among" and "coincided with", never "caused". And each figure needs its base and period in the same sentence: "1,180 of the 14,600 adults in the service area reported no usual source of care in 2023" is checkable, while "access is limited" is a summary of an impression.
Passing and strong in a needs assessment
A passing assessment is thorough and undecided. It presents a well-organized picture of a community's problems and recommends that several of them be addressed. Nothing in it is wrong. It also cannot be executed, because no organization can start eight things, and the rubric rows about prioritization and feasibility have nothing specific to score.
Assessments also get marked down for a quieter fault: indicators chosen because they were available rather than because the organization could act on them. If a figure appears in your document and no service you could plausibly offer would move it, it belongs in the background, not in the shortlist. Cutting those frees the words the prioritization section needs.
A strong assessment chooses, and shows the reasoning that produced the choice. It states the criteria before applying them, so the decision looks like a method rather than a preference. It says out loud what is being deferred and roughly for how long, which is the sentence that reads as leadership. It attaches a service response sized to real capacity. And it names the equity consequence of the choice, because deferring a problem always defers it for a specific group of people.
Six habits that cost marks in NR-586AT
- Dumping indicators. Twenty figures with no comparison is a report. Five with comparisons and sources is an assessment.
- Priorities with no criteria. If the reader cannot reconstruct why this problem and not that one, the heaviest row scores low.
- Skipping the people. A population described entirely through data is missing the input that rubrics at this level specifically ask for, and it is usually the section where a grader can tell whether you have ever sat in a community meeting.
- Treating a small-area rate as stable. Where counts are low, single-year swings are noise, and calling them trends is an analytic error.
- Naming the organization. Type, size and setting are sufficient and carry none of the exposure.
- Pasting a discussion post before it is finished. Posts do not reopen once submitted at Chamberlain, so compose it elsewhere first.
Questions NR-586AT students ask
Everything in my community looks like a priority. How do I choose one?
I cannot survey or interview anyone. Does the community voice section still work?
How recent does population data have to be?
Where NR-586AT sits in Chamberlain's programs
Open the exact program map for sequence, credit, and option context. The current student schedule and syllabus remain authoritative after transfer evaluation, electives, state rules, and approved plan changes.
The weeks, one by one
Week 1
NR-586AT runs population health and epidemiology for the accelerated MSN advanced nursing leadership options, which changes the audience rather than the subject: you are writing as someone who will be accountable for a service, and the first stage asks you to define the population that service is answerable for. Read the full Week 1 manual.
Week 2
The measurement stage of NR-586AT asks a leader to assemble a small set of indicators and defend each one. Read the full Week 2 manual.
Week 3
Comparison is the stage where an indicator set becomes an argument. Read the full Week 3 manual.
Week 4
This stage asks a leader to put qualitative input beside the indicator set and to handle the disagreement between them rather than smoothing it over. Read the full Week 4 manual.
Week 5
This is the stage where an assessment becomes a decision. Read the full Week 5 manual.
Week 6
Having chosen a priority, a leader now has to show that the proposed response is likely to work here. Read the full Week 6 manual.
Week 7
The preparedness stage of NR-586AT asks a leader to write continuity for a service rather than a general description of a hazard. Read the full Week 7 manual.
Week 8
The closing stage of NR-586AT converts eight weeks of assessment into something a quality committee could approve: a specified implementation, an evaluation plan attached to data that exists, a resource request in real units, and a one-page case that a reader with four minutes can act on. Read the full Week 8 manual.