NR-552 Economics of Healthcare Policy carries three theory credits and covers national and global healthcare economics, financing, insurance and access, and what those arrangements do to patient outcomes. The graded writing asks you to hold two questions at once on every page: what does this cost, and to whom. Papers that answer only the first read as journalism, and the analysis rows treat them accordingly.
What NR-552 actually grades
Vocabulary used strictly. In an economics course a charge is not a cost, a cost is not a price, and reimbursement is a fourth thing again. A grader can tell within two paragraphs whether a student is using these terms as synonyms, and once they are being used loosely, no later argument can be checked. The same applies to savings, which always requires an answer to the question saved by whom, since money removed from one party's ledger has usually appeared on another's.
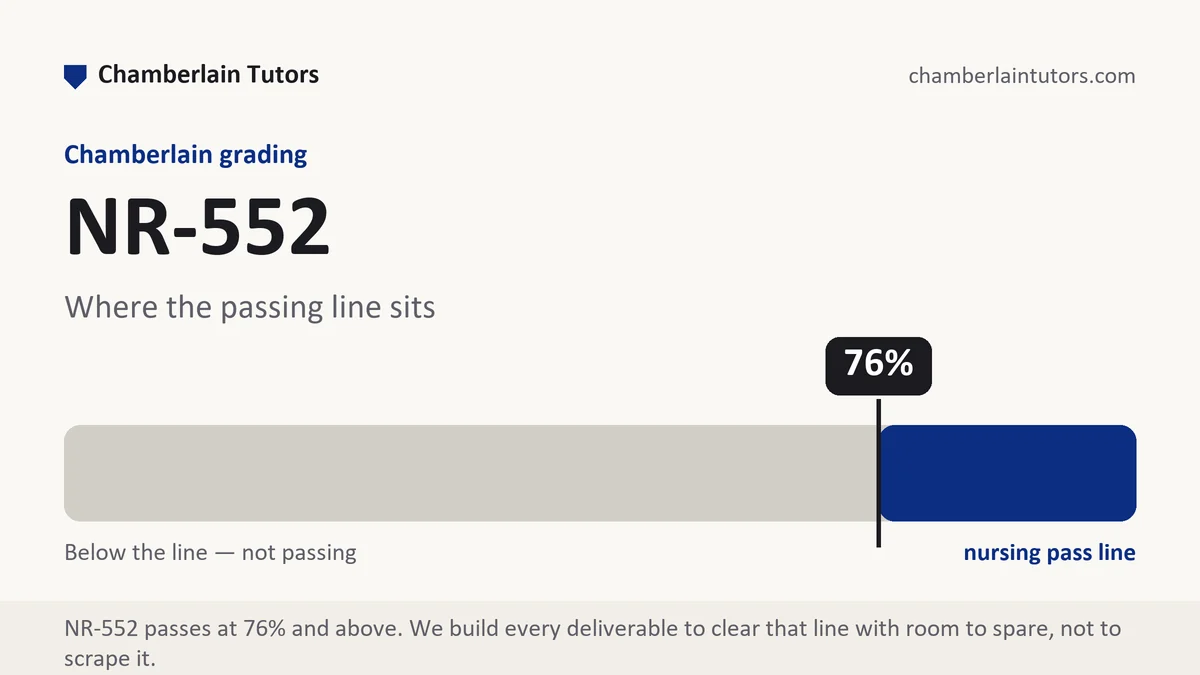
The second axis is whether trade-offs appear at all. Policy economics is the study of choosing under constraint, so a proposal with no opportunity cost stated has skipped the discipline entirely. Chamberlain's 76 percent floor for core nursing courses applies here as elsewhere, and with weekly deliverables inside an eight-week session the average settles quickly. Supplementary work does not lift a weighted average that has already formed, so precision has to arrive in the early weeks rather than the last one.
How we help in this course
We draft financing and coverage analyses, cost write-ups, insurance mechanism papers, international comparison essays, policy option memos, discussion responses and the session project. Our drafts label every dollar figure with its year and every claim about savings with the party whose ledger it lands on, because those two habits carry most of the difference in this course.
We work from published sources you can cite and from the scenario your prompt sets. We do not obtain financial data from your employer, contact payers or agencies, or produce figures presented as institutional data. If your section asks you to use a real budget you have access to, you supply what you may share and we build the analysis around it.
In NR-552 right now?
Send the policy or financing question and the rubric from Canvas. First premium sample free, floor-checked, back in 24 to 48 hours.
Read the rubric before the prompt
Economics guides tend to weight one row far above the rest, and finding it early changes the whole evening. Copy the criterion rows into a blank document and cut each to its verb: explain, analyze, compare, evaluate, recommend. Where a row says analyze the economic implications and another says describe the policy, the description row is scaffolding and the analysis row is the assignment.
Then convert weights into words. Take a 1,300 word paper with four rows at 50, 20, 20 and 10 percent. Multiply through and the first row takes 650 words, the next two take 260 each, and the last takes 130. A single row worth half the paper is common in this course and it is almost always the analysis. Six hundred and fifty words is a real economic argument: baseline, mechanism, who pays, what is given up. Students who spend that budget explaining what the policy is have written a summary against a row that asked for reasoning. Title page and references sit outside the count unless your guide says otherwise.
Put the four numbers beside your headings and check them before you write the recommendation. If the description has run long, cut it rather than exceeding the cap, because an overlong paper in this course usually signals that the reasoning never started.
The shape of a policy economics brief
Under any section title, the dominant deliverable here explains where money moves and what that movement does to care. These are the parts that carry marks.
| Part | What it must pin down | What a weak version does |
|---|---|---|
| The question as an allocation problem | What resource is scarce and who is deciding how it is divided. | States that healthcare is expensive in the United States. |
| Baseline spending | Current spending on the thing in question, with the year of the dollars and the source. | A large number with no year and no denominator. |
| Payer and beneficiary | Who writes the check, who receives the service, and who bears the risk when costs rise. | Treats the system as a single payer of last resort. |
| Financing mechanism | Premiums, deductibles, capitation, fee for service, global budget, subsidy, and how each changes behavior. | Mentions insurance without describing how money reaches providers. |
| Analysis type, declared | Whether you are arguing cost saving, cost effectiveness or value, and which perspective you are using. | Uses all three interchangeably in one paragraph. |
| Assumptions, listed | The two or three things that must hold for your numbers to work. | Presents projections as facts. |
| Opportunity cost | What is not funded if this is funded, named specifically. | Asserts the policy pays for itself. |
| Access and outcome effects | What changes for patients at the margin, especially those who currently delay care. | Ends at the balance sheet. |
Evidence and citation craft at this level
Money numbers are the least stable evidence you will handle in the program, and four habits keep them honest.
Currency means the dollar year as well as the publication year. Where your guide sets no rule, treat five years as the line for policy literature, and give every dollar figure the year its dollars are denominated in. Comparing an amount from one decade with an amount from another without adjustment is not a comparison; if you adjust, say so and name the base year. This one habit separates economics writing from opinion writing more sharply than any other.
Say whether the number was observed or modeled. Much of what gets quoted in policy debate comes from projections, and projections are arguments with arithmetic attached. Nine words of setup, such as in a ten-year projection using assumptions about enrollment, tells the reader what they are holding. Where the number is observed, say from what: claims data, national accounts, a survey of employers, each with different coverage and lag.
Verbs the design can pay for. Coverage and payment changes are studied with observational designs and natural experiments far more often than with trials, so was followed by, coincided with and was associated with lower out-of-pocket spending are the workhorse constructions. Reserve caused and reduced for evaluations with a credible comparison. Interest-group publications are the specific trap here: they are written in causal verbs and their evidence rarely supports them, so cite them for a position rather than for a fact.
Denominator and window on every amount. A total is uninterpretable on its own. Write 412 dollars per member per month across the 18,000 covered lives in the plan year rather than 89 million dollars in spending, and say whether a figure is annual, monthly or lifetime. For international comparisons, state whether spending is per capita, whether it is adjusted for price differences between countries, and which years are being placed side by side.
What separates a passing brief from a strong one
A passing brief describes a policy, quotes a national spending figure, and argues that the approach would reduce costs while improving access. It scores in the high seventies to low eighties because every number in it is unanchored and no one in the paper loses anything.
Strong briefs do three things. They fix a perspective in the first page, saying whether the analysis is written from the point of view of the payer, the health system, the patient or society, and they hold it, because a saving from one perspective is frequently a transfer from another. They separate cost effectiveness from cost saving explicitly, since an intervention can be excellent value and still increase total spending, and confusing the two is the most consequential error available in this course. And they name the losers: the service that goes unfunded, the group whose premiums rise, the provider whose margin falls. A paper that says who pays for the improvement is doing economics; a paper in which everyone gains is doing advocacy.
Mistakes that cost points here
- Dollars with no year. An unlabeled figure cannot be compared to anything, including the figure two paragraphs later.
- Charges quoted as costs. Billed charges, negotiated prices, allowed amounts and actual costs of production are four different numbers. Say which one you have.
- Savings with no perspective. Money saved by an insurer may have moved to households as out-of-pocket spending. Name the ledger.
- Cross-country comparisons taken raw. Currency conversion, price levels and what each country counts as health spending all differ. Note the adjustment or note its absence.
- Reduce waste as a recommendation. Everyone agrees with it and nobody can act on it. Name the payment rule, the benefit design or the administrative step you would change.
- Posting a figure you have not checked. Discussion responses do not reopen once submitted at Chamberlain, so an unsourced billion-dollar claim stays on the board all week. Verify, then paste.
Questions NR-552 students ask
My sources report dollars from different years. How do I handle that?
What perspective should I write the analysis from?
Does my paper need cost effectiveness, cost benefit or cost savings?
Where NR-552 sits in Chamberlain's programs
Open the exact program map for sequence, credit, and option context. The current student schedule and syllabus remain authoritative after transfer evaluation, electives, state rules, and approved plan changes.
The weeks, one by one
Week 1
NR-552 Week 1 is where a nurse learns to argue in the language money is argued in. Read the full Week 1 manual.
Week 2
NR-552 Week 2 puts the supply and demand apparatus on health care and asks you to explain why it fits badly. Read the full Week 2 manual.
Week 3
The territory is health care financing: where the dollars originate, which intermediaries hold them, what path they take to reach the clinician who delivered care, and what each handoff does to behavior along the way. Read the full Week 3 manual.
Week 4
NR-552 Week 4 examines the machinery inside an insurance product and what that machinery does to behavior. Read the full Week 4 manual.
Week 5
NR-552 Week 5 turns to access, which in a health economics course means something more demanding than whether a person holds a card. Read the full Week 5 manual.
Week 6
How a provider is paid determines what a provider does more of, and every payment method in use is a different answer to the question of who carries the financial risk when care turns out to cost more than expected. Read the full Week 6 manual.
Week 7
NR-552 Week 7 sets national spending beside national results and asks what the money bought. Read the full Week 7 manual.
Week 8
NR-552 Week 8 closes the session by making you spend money on paper. Read the full Week 8 manual.